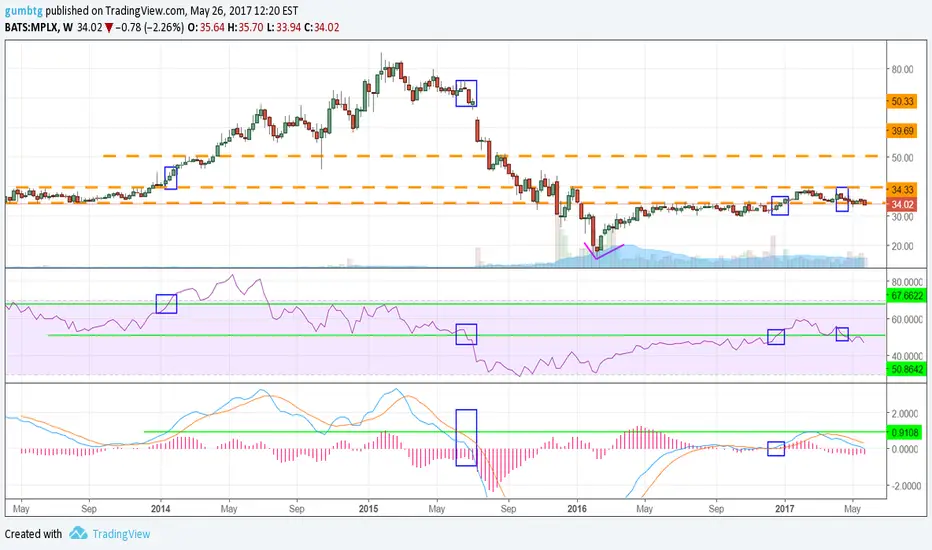
Note the MACD resistance line I drew. Still trying to back test that strategy of a MACD resistance line.
Maybe the start of a new trading range here. We will see. The orange resistance line may be off by a few cents, but the general placement is correct.
Would be interested to see what the stochastic would show us.
Any one have any comments on my price action analysis? Did I miss an major chart patterns???
-If you find this idea interesting please leave a like
-Follow for more
-Comments are always welcomed and appreciated
-Follow for more
-Comments are always welcomed and appreciated
Disclaimer
The information and publications are not meant to be, and do not constitute, financial, investment, trading, or other types of advice or recommendations supplied or endorsed by TradingView. Read more in the Terms of Use.