MSFT Post-Earnings Surge — Consolidation Before Another Leg Up or First Sign of Exhaustion?
🔍 GEX & Options Flow Insight (1st Image Analysis)
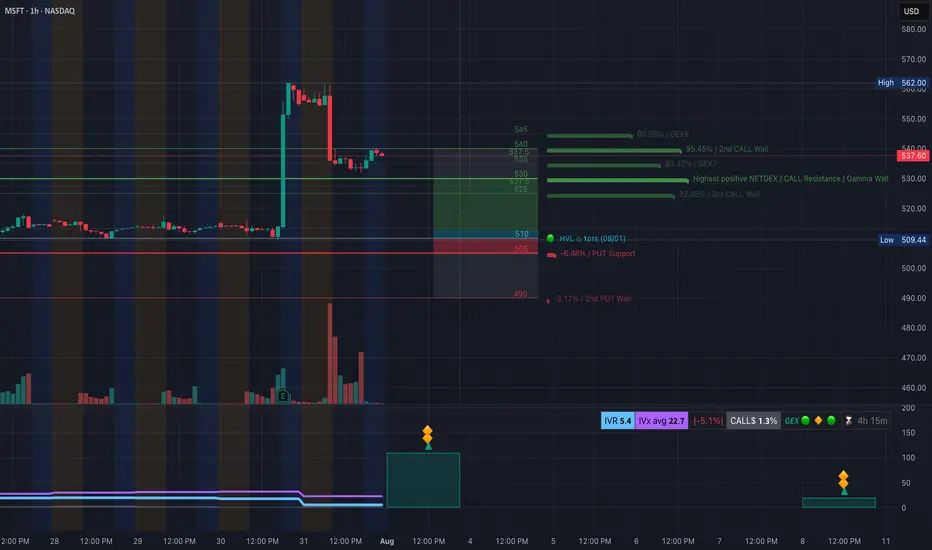
Microsoft exploded higher after earnings, reaching the mid-$530s before pulling back slightly. It now sits between strong gamma support and a major Call Wall cluster, indicating a consolidation phase that could lead to either a continuation move or a deeper retracement.
* Call Walls & Resistance:
* 📍 $537.60 → Current price zone, right under minor gamma resistance
* 📍 $540.00 → 2nd Call Wall (95.45% GEX7)
* 🧱 $545–$562 → GEX8/extension zone for a bullish breakout target
* Put Support Zones:
* 🛡️ $530–$525 → Gamma pivot area; losing this would weaken bullish positioning
* 📉 $510.00–$505.00 → Strong HVL + PUT wall support
* 🚨 $490 → Second PUT wall = major breakdown trigger
* Volatility Insight:
* IVR 5.4, IVx Avg 22.7 → Low IV = cheaper premium for spreads
* Call flow 1.3% = Low aggressive bullish positioning
* GEX sentiment: 🟢🟡🟢 = Still supportive for consolidation with bullish lean
✅ Option Trading Suggestion:
Bias: Bullish consolidation, but near-term capped under $540 unless volume expansion Strategy: Debit call spread for limited risk
* Entry Idea: Buy 540C / Sell 550C for Aug 2 or Aug 9 expiry
* Invalidation: Daily close under $525
* Target: $545 short-term, $562 on breakout
Why this works: MSFT is supported by gamma positioning above $525 and could make a clean push toward $545+ if earnings momentum continues. Spreads help protect from IV crush after earnings.
🧠 Technical Analysis (1H Chart) (2nd Image Analysis)

Market Structure & SMC:
* ✅ Clear BOS (Break of Structure) on earnings gap
* 🟢 Price is consolidating within the post-gap range
* ⚠️ Potential CHoCH forming if price fails $525, which would indicate weakness
Trendline Dynamics:
* Holding above short-term uptrend support line
* Still in a steep post-gap bullish channel
SMC Zones:
* 🟩 Demand / OB Zone: $530–$525 → High-probability bounce area
* 🟥 Supply Zone (Purple Box): $538–$545 → Overhead resistance from post-gap highs
🔄 Price Action & Key Levels
* Support:
* ✅ $530–$525 → First defensive zone
* ✅ $517–$513 → Secondary support
* 🚨 $510–$505 → Hard gamma floor
* Resistance:
* 🚩 $540 → 2nd Call Wall resistance
* 🚀 $545–$562 → Extension zone if breakout occurs
🧭 Scalping / Intraday Trade Setup
🟩 Bullish Setup:
* Entry: $530–$532 dip reclaim
* Target 1: $540
* Target 2: $545–$550 extension
* Stop: Close under $525
🟥 Bearish Pullback Setup:
* Entry: Rejection at $540
* Target 1: $530
* Target 2: $525
* Stop: Breakout above $540 with volume
🔁 Summary Thoughts
* MSFT has post-earnings momentum but is consolidating just below a Call Wall cluster.
* Holding $525–$530 keeps the bullish case alive toward $545+.
* Options are cheap enough for defined-risk bullish spreads, but caution if $525 breaks.
* Expect range-bound chop until a decisive breakout over $540 or a breakdown under $525.
🚨 Disclaimer:
This analysis is for educational purposes only and does not constitute financial advice. Always do your own research and manage your risk accordingly.
🔍 GEX & Options Flow Insight (1st Image Analysis)
Microsoft exploded higher after earnings, reaching the mid-$530s before pulling back slightly. It now sits between strong gamma support and a major Call Wall cluster, indicating a consolidation phase that could lead to either a continuation move or a deeper retracement.
* Call Walls & Resistance:
* 📍 $537.60 → Current price zone, right under minor gamma resistance
* 📍 $540.00 → 2nd Call Wall (95.45% GEX7)
* 🧱 $545–$562 → GEX8/extension zone for a bullish breakout target
* Put Support Zones:
* 🛡️ $530–$525 → Gamma pivot area; losing this would weaken bullish positioning
* 📉 $510.00–$505.00 → Strong HVL + PUT wall support
* 🚨 $490 → Second PUT wall = major breakdown trigger
* Volatility Insight:
* IVR 5.4, IVx Avg 22.7 → Low IV = cheaper premium for spreads
* Call flow 1.3% = Low aggressive bullish positioning
* GEX sentiment: 🟢🟡🟢 = Still supportive for consolidation with bullish lean
✅ Option Trading Suggestion:
Bias: Bullish consolidation, but near-term capped under $540 unless volume expansion Strategy: Debit call spread for limited risk
* Entry Idea: Buy 540C / Sell 550C for Aug 2 or Aug 9 expiry
* Invalidation: Daily close under $525
* Target: $545 short-term, $562 on breakout
Why this works: MSFT is supported by gamma positioning above $525 and could make a clean push toward $545+ if earnings momentum continues. Spreads help protect from IV crush after earnings.
🧠 Technical Analysis (1H Chart) (2nd Image Analysis)
Market Structure & SMC:
* ✅ Clear BOS (Break of Structure) on earnings gap
* 🟢 Price is consolidating within the post-gap range
* ⚠️ Potential CHoCH forming if price fails $525, which would indicate weakness
Trendline Dynamics:
* Holding above short-term uptrend support line
* Still in a steep post-gap bullish channel
SMC Zones:
* 🟩 Demand / OB Zone: $530–$525 → High-probability bounce area
* 🟥 Supply Zone (Purple Box): $538–$545 → Overhead resistance from post-gap highs
🔄 Price Action & Key Levels
* Support:
* ✅ $530–$525 → First defensive zone
* ✅ $517–$513 → Secondary support
* 🚨 $510–$505 → Hard gamma floor
* Resistance:
* 🚩 $540 → 2nd Call Wall resistance
* 🚀 $545–$562 → Extension zone if breakout occurs
🧭 Scalping / Intraday Trade Setup
🟩 Bullish Setup:
* Entry: $530–$532 dip reclaim
* Target 1: $540
* Target 2: $545–$550 extension
* Stop: Close under $525
🟥 Bearish Pullback Setup:
* Entry: Rejection at $540
* Target 1: $530
* Target 2: $525
* Stop: Breakout above $540 with volume
🔁 Summary Thoughts
* MSFT has post-earnings momentum but is consolidating just below a Call Wall cluster.
* Holding $525–$530 keeps the bullish case alive toward $545+.
* Options are cheap enough for defined-risk bullish spreads, but caution if $525 breaks.
* Expect range-bound chop until a decisive breakout over $540 or a breakdown under $525.
🚨 Disclaimer:
This analysis is for educational purposes only and does not constitute financial advice. Always do your own research and manage your risk accordingly.
Disclaimer
The information and publications are not meant to be, and do not constitute, financial, investment, trading, or other types of advice or recommendations supplied or endorsed by TradingView. Read more in the Terms of Use.
Disclaimer
The information and publications are not meant to be, and do not constitute, financial, investment, trading, or other types of advice or recommendations supplied or endorsed by TradingView. Read more in the Terms of Use.