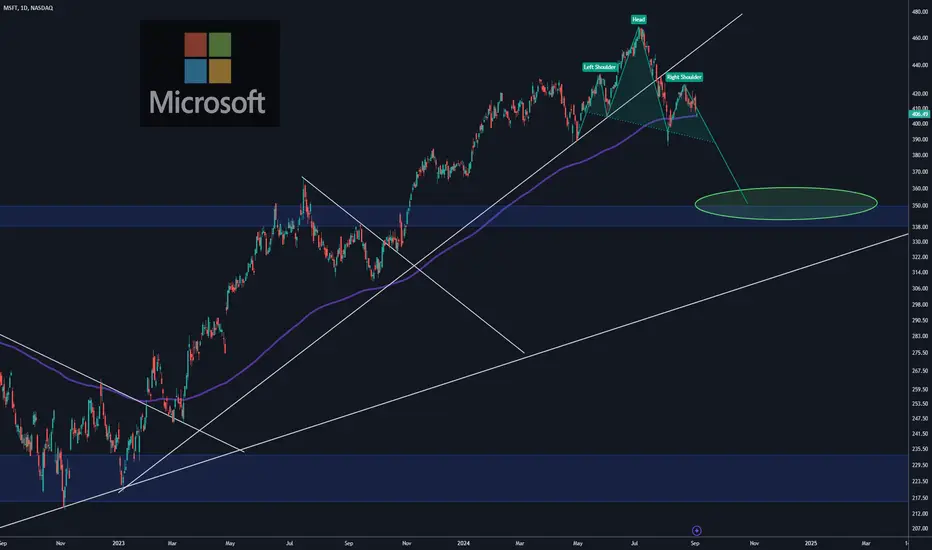
A head and shoulders pattern appears to be forming on the Microsoft Corporation (NASDAQ: MSFT) stock chart.
The right shoulder of the pattern is currently taking shape, indicating that the stock price could drop to the neckline at 385.00 USD.
A break below this level may lead to a further decline in price to 340.00 USD.
The right shoulder of the pattern is currently taking shape, indicating that the stock price could drop to the neckline at 385.00 USD.
A break below this level may lead to a further decline in price to 340.00 USD.
Disclaimer
The information and publications are not meant to be, and do not constitute, financial, investment, trading, or other types of advice or recommendations supplied or endorsed by TradingView. Read more in the Terms of Use.
Disclaimer
The information and publications are not meant to be, and do not constitute, financial, investment, trading, or other types of advice or recommendations supplied or endorsed by TradingView. Read more in the Terms of Use.