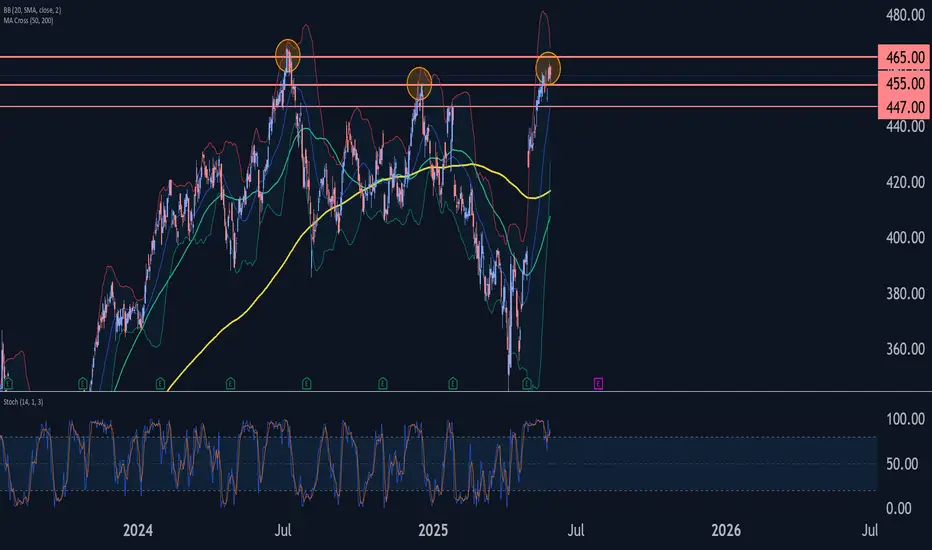
- Microsoft reversed from resistance zone
- Likely to fall to support level 447.00
Microsoft recently reversed down from the resistance zone located between the resistance levels 465.00 (which stopped the weekly uptrend in 2024) and 455.00 (top of wave (B) from the end of 2024).
This resistance zone was further strengthened by the upper weekly and daily Bollinger Bands.
Given the strength of the aforementioned resistance zone and the overbought daily Stochastic, Microsoft can be expected to fall to the next support level 447.00.
Alexander Kuptsikevich,
Chief Market Analyst at FxPro
----------
Follow our Telegram channel t.me/fxpro dedicated to providing insightful market analysis and expertise.
Reach out to media.comments@fxpro.com for PR and media inquiries
Chief Market Analyst at FxPro
----------
Follow our Telegram channel t.me/fxpro dedicated to providing insightful market analysis and expertise.
Reach out to media.comments@fxpro.com for PR and media inquiries
Disclaimer
The information and publications are not meant to be, and do not constitute, financial, investment, trading, or other types of advice or recommendations supplied or endorsed by TradingView. Read more in the Terms of Use.