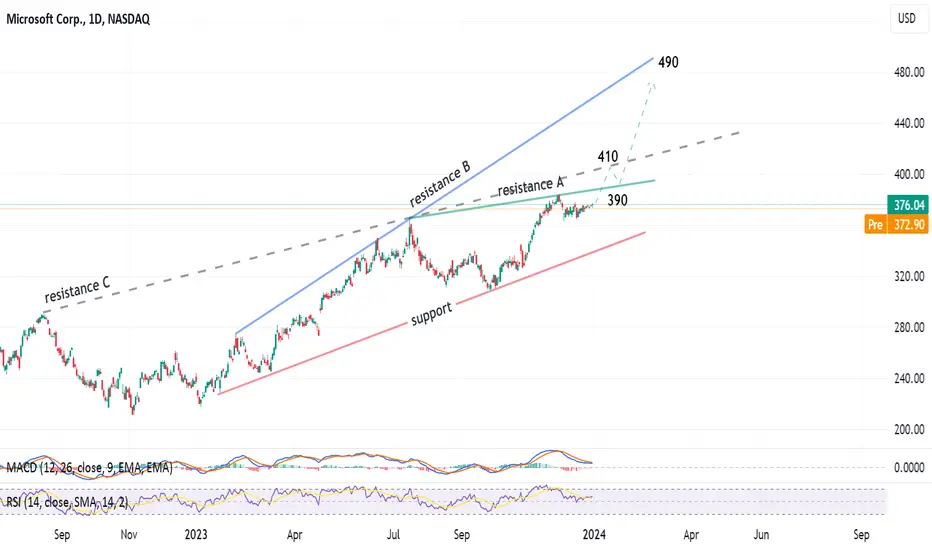
Daily chart, the MSFT stock is trading in an expanding triangle. After crossing resistance A (green), the target will be 410, after crossing resistance C (GREY dashed|), the target will be 490 (targeting the blue resistance B line
Trade active
Disclaimer
The information and publications are not meant to be, and do not constitute, financial, investment, trading, or other types of advice or recommendations supplied or endorsed by TradingView. Read more in the Terms of Use.
Disclaimer
The information and publications are not meant to be, and do not constitute, financial, investment, trading, or other types of advice or recommendations supplied or endorsed by TradingView. Read more in the Terms of Use.