Broader Market Structure (MSFT 15M):
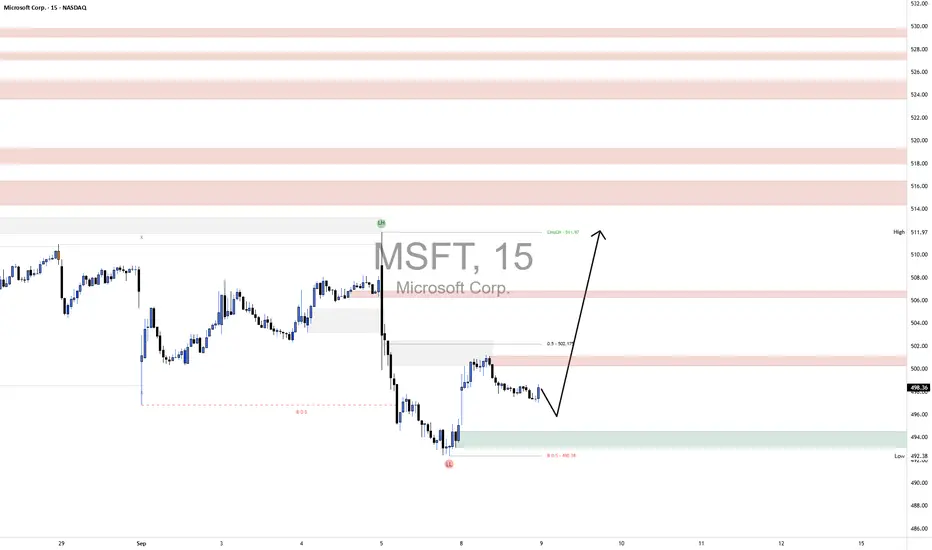
Microsoft’s short-term structure shows a clear bearish shift. After printing a high at 511.97, price rolled over, creating a Change of Character (CHoCH) and following through with a Break of Structure (BOS) to the downside at 492.38. This confirmed a shift from bullish momentum into bearish control. The retracement attempts since then have failed to reclaim higher levels, keeping the broader 15M trend tilted bearish for now.
Supply and Demand Zones:
The nearest demand zone sits around 493–494, where buyers previously stepped in with strength, halting the selloff and producing a temporary bounce. This is a key support area and the likely base for any potential reversal attempt. On the upside, the nearest supply zone lies around 502–503, which is weakly defended at the moment since sellers pushed from there but not with extreme force. Above that, stronger supply levels remain between 515–518 and higher toward 524–526, where price previously dropped sharply, making them more decisive zones of resistance.
Price Action in the Marked Region:
Currently, price is consolidating just above the lower demand area near 494, suggesting buyers are trying to defend this level. The projection drawn on the chart points to one more dip into demand before a bounce higher toward the mid-supply at 502. The candles show slowing bearish momentum as the push lower has less follow-through, indicating buyers could soon regain control if demand holds.
Trade Bias & Outlook:
The bias is cautiously bullish for a corrective move higher, with the expectation that price will test demand at 494 before bouncing toward 502. The invalidation level for this outlook is a clean break and close below 492.38, which would confirm sellers remain firmly in control and open the way for deeper downside.
Momentum & Candle Behavior:
Short-term momentum still leans bearish, but it is weakening as the selloff decelerates near demand. A confirming bullish engulfing or rejection wick from the 493–494 zone would strengthen the bullish bounce case. Without such confirmation, sellers may continue pressing lower.
Looking for powerful AI trading signals? Visit ProSignal.ai and take your trading to the next level! or join our telegram channel at t.me/prosignalai
Disclaimer
The information and publications are not meant to be, and do not constitute, financial, investment, trading, or other types of advice or recommendations supplied or endorsed by TradingView. Read more in the Terms of Use.