WaverVanir International LLC – VolanX Macro/Technical Outlook
Microsoft (
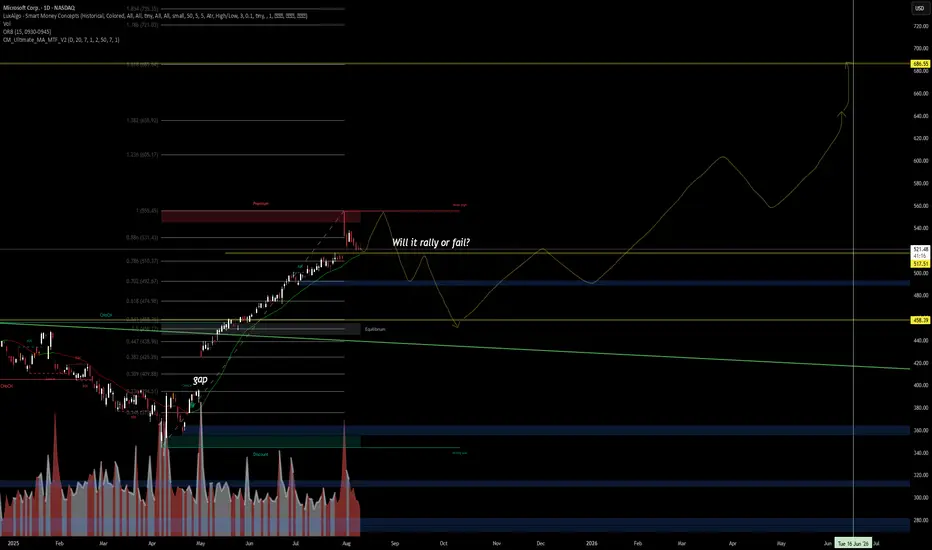
Technical Highlights:
Price currently hovering around $521, with immediate support at $517.51.
Fibonacci retracement levels show potential retrace targets at $492 (0.702) and $458 (Equilibrium Zone).
Previous market structure shift (CHoCH) remains intact — bulls still control the macro trend.
Gap from April remains a historical liquidity zone.
Volume analysis shows tapering interest post-peak, signaling possible short-term weakness.
VolanX Scenario Projections:
Bullish Case: Strong defense at $517–$500, leading to a wave structure breakout towards $686.55 by mid-2026.
Bearish Case: Failure to hold $500 could drive a liquidity sweep toward $458 before a possible long-term continuation higher.
Macro View:
While fundamentals remain strong, the broader NASDAQ environment and AI sector momentum will dictate if Microsoft can rally without retesting deeper supports. Watch for liquidity grabs in discount zones as potential institutional entries.
📊 VolanX Bias: Neutral-Bullish, but we remain patient for an optimal risk-entry confirmation.
Disclaimer: This is not financial advice. For educational purposes only. VolanX models are probabilistic, not predictive.
Disclaimer
The information and publications are not meant to be, and do not constitute, financial, investment, trading, or other types of advice or recommendations supplied or endorsed by TradingView. Read more in the Terms of Use.
Disclaimer
The information and publications are not meant to be, and do not constitute, financial, investment, trading, or other types of advice or recommendations supplied or endorsed by TradingView. Read more in the Terms of Use.