🧠 Options GEX Analysis – Bullish Bias Above 497.5
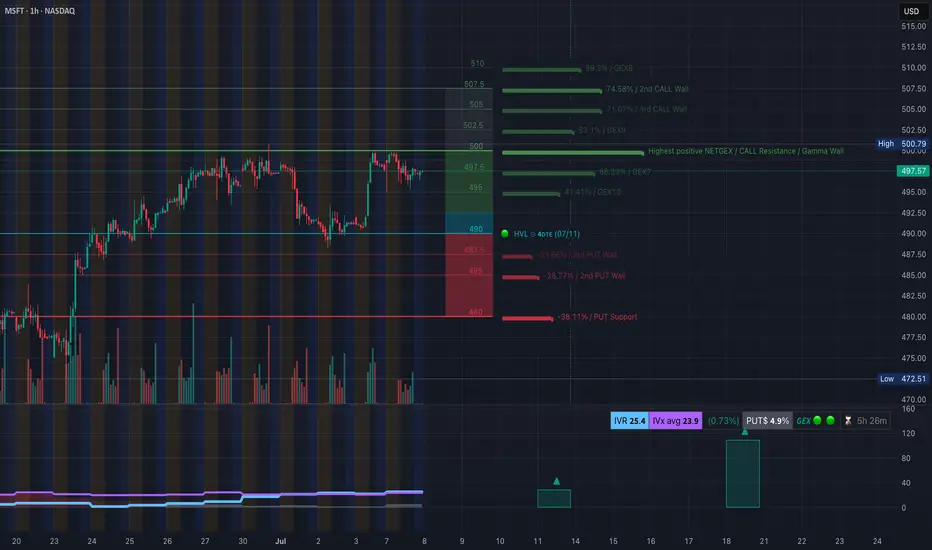
* Gamma Wall / Resistance at 500–502.5 There is clear call resistance at 500.79, aligning with heavy GEX levels at 502.5 and 507.5, with the 2nd Call Wall peaking at 74.58%. This sets a magnetic zone IF MSFT pushes above 498.
* Below 490 = Risky Territory The HVL support zone (07/11) sits at 490. A breakdown below this may open up weakness toward 485 (2nd PUT Wall at -28.77%) and even 480 where heavy PUT support lies at -38.11%.
* Implied Volatility & Sentiment
* IVR: 25.4, IVx avg: 23.9 → Moderate volatility
* PUTs: 4.9% bias, GEX: Bullish (🟢🟢🟢) This leans bullish short-term, but caution is advised on a break under 490.
📉 1-Hour Chart Insights – Price Action + SMC

* Structure: BOS and CHoCH confirmed. Price pushed above structure but is now consolidating below 500, suggesting indecision.
* Fair Value Gap + Order Block Retest The recent CHoCH is forming near 500, and price is reacting to the purple SMC zone. Price is holding above the bullish OB and BOS zone around 480–488. This is key demand.
* Trend: As long as price stays above the SMC bullish OB and GEX support at 490, a potential continuation toward 502.5–507.5 remains valid.
📌 Game Plan / Suggestions
Bullish Setup:
* Entry: Above 498–500 breakout
* Target: 502.5, 507.5
* Stop: Under 490 or conservative at 488
Bearish Setup:
* Entry: Below 488 break
* Target: 485, then 480 PUT zone
* Stop: Above 492
Watch the opening range – if MSFT gaps above 498 with momentum, bulls could dominate. But failure at 500 means this could fade back into the OB zone.
🎯 Final Thoughts
This is a make-or-break zone for MSFT — smart money has positioned resistance at 500+ while GEX still supports upside bias above 490. Stay nimble.
Disclaimer: This analysis is for educational purposes only and does not constitute financial advice. Always do your own research and manage risk.
* Gamma Wall / Resistance at 500–502.5 There is clear call resistance at 500.79, aligning with heavy GEX levels at 502.5 and 507.5, with the 2nd Call Wall peaking at 74.58%. This sets a magnetic zone IF MSFT pushes above 498.
* Below 490 = Risky Territory The HVL support zone (07/11) sits at 490. A breakdown below this may open up weakness toward 485 (2nd PUT Wall at -28.77%) and even 480 where heavy PUT support lies at -38.11%.
* Implied Volatility & Sentiment
* IVR: 25.4, IVx avg: 23.9 → Moderate volatility
* PUTs: 4.9% bias, GEX: Bullish (🟢🟢🟢) This leans bullish short-term, but caution is advised on a break under 490.
📉 1-Hour Chart Insights – Price Action + SMC
* Structure: BOS and CHoCH confirmed. Price pushed above structure but is now consolidating below 500, suggesting indecision.
* Fair Value Gap + Order Block Retest The recent CHoCH is forming near 500, and price is reacting to the purple SMC zone. Price is holding above the bullish OB and BOS zone around 480–488. This is key demand.
* Trend: As long as price stays above the SMC bullish OB and GEX support at 490, a potential continuation toward 502.5–507.5 remains valid.
📌 Game Plan / Suggestions
Bullish Setup:
* Entry: Above 498–500 breakout
* Target: 502.5, 507.5
* Stop: Under 490 or conservative at 488
Bearish Setup:
* Entry: Below 488 break
* Target: 485, then 480 PUT zone
* Stop: Above 492
Watch the opening range – if MSFT gaps above 498 with momentum, bulls could dominate. But failure at 500 means this could fade back into the OB zone.
🎯 Final Thoughts
This is a make-or-break zone for MSFT — smart money has positioned resistance at 500+ while GEX still supports upside bias above 490. Stay nimble.
Disclaimer: This analysis is for educational purposes only and does not constitute financial advice. Always do your own research and manage risk.
Disclaimer
The information and publications are not meant to be, and do not constitute, financial, investment, trading, or other types of advice or recommendations supplied or endorsed by TradingView. Read more in the Terms of Use.
Disclaimer
The information and publications are not meant to be, and do not constitute, financial, investment, trading, or other types of advice or recommendations supplied or endorsed by TradingView. Read more in the Terms of Use.