🧠 GEX and Options Sentiment (TanukiTrade GEX)
* GEX Zone Summary:
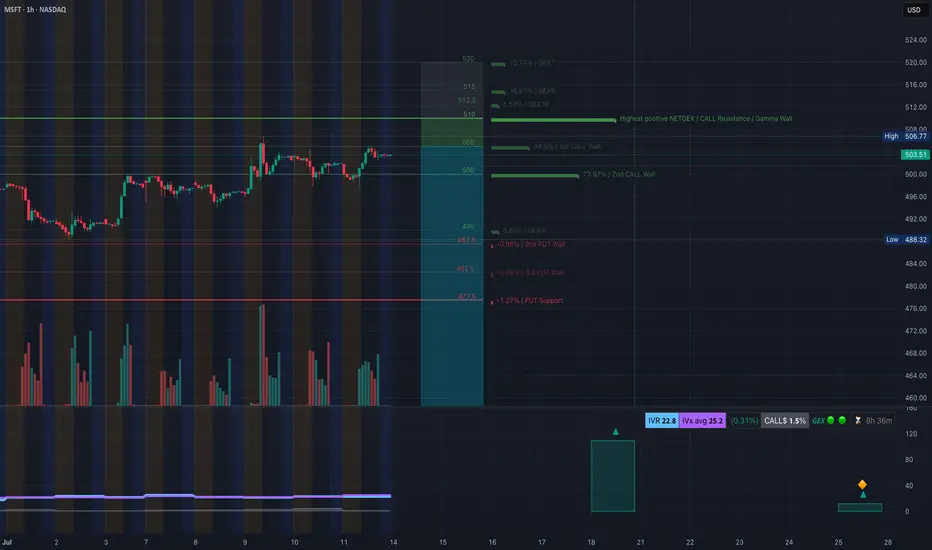
* 📈 Call Wall 1 (503.5–506.7) → major Gamma Resistance.
* 🧱 Gamma Wall (506.77) = Highest positive NETGEX — key sell zone for market makers.
* 🟢 GEX Flow: Moderate call dominance (1.95%) — not yet extreme bullish.
* 🟣 IVR 22.8 (low), IVX avg 25.2 – implied vol remains subdued.
* Options Suggestion:
* ⚠️ A move above 506.8 could trigger dealer hedging and gamma squeeze.
* Trade Idea (Bullish):
* Buy 510C or 515C (Jul 19/Jul 26 expiry) on breakout above 507 with volume.
* Stop: <503. Target: 512/516.
* 🚨 If rejection at Gamma Wall (506.8), fade the move:
* Trade Idea (Bearish):
* Buy 500P or 495P on rejection or candle close below 503.
* Target: 497.8 / 494. Stop: 506.5.
📉 1H Technical Trading Plan (Smart Money Concepts)

* Structure:
* Price made CHoCH → BOS toward 506 zone, now consolidating below resistance.
* Minor rejection seen from inside the purple supply box at 506.
* If bulls hold 501–503 zone, could be prepping a second push.
* Key Levels:
* Support: 501.48 / 497.78 / 494.11
* Resistance: 504.46 / 506.77
* Bias:
* 🟢 Bullish above 504.50, expecting breakout toward 510–512.
* 🔴 Bearish below 501.5, likely drop toward 497.8–495.
* Intraday Trading Setup:
* Scalp Long: Entry 504.5–505. Breakout candle confirmation.
* TP: 507. SL: 503.8
* Scalp Short: Entry <501.3
* TP: 498, SL: 503
* Swing Trade Scenario:
* Enter swing calls above 507. Hold for 515+ next week.
* Enter puts only if breakdown below 497.8 with CHoCH back down.
🎯 Final Thoughts:
MSFT is trading tightly below a significant GEX Call Wall, which often leads to a volatile breakout or strong rejection. If bulls push through 507+, we could see a sharp gamma squeeze into 510–515. However, if this fails, price may fade back toward 495–490 zone quickly. Patience at resistance is key.
Disclaimer: This analysis is for educational purposes only and does not constitute financial advice. Always do your own research and manage risk appropriately.
* GEX Zone Summary:
* 📈 Call Wall 1 (503.5–506.7) → major Gamma Resistance.
* 🧱 Gamma Wall (506.77) = Highest positive NETGEX — key sell zone for market makers.
* 🟢 GEX Flow: Moderate call dominance (1.95%) — not yet extreme bullish.
* 🟣 IVR 22.8 (low), IVX avg 25.2 – implied vol remains subdued.
* Options Suggestion:
* ⚠️ A move above 506.8 could trigger dealer hedging and gamma squeeze.
* Trade Idea (Bullish):
* Buy 510C or 515C (Jul 19/Jul 26 expiry) on breakout above 507 with volume.
* Stop: <503. Target: 512/516.
* 🚨 If rejection at Gamma Wall (506.8), fade the move:
* Trade Idea (Bearish):
* Buy 500P or 495P on rejection or candle close below 503.
* Target: 497.8 / 494. Stop: 506.5.
📉 1H Technical Trading Plan (Smart Money Concepts)
* Structure:
* Price made CHoCH → BOS toward 506 zone, now consolidating below resistance.
* Minor rejection seen from inside the purple supply box at 506.
* If bulls hold 501–503 zone, could be prepping a second push.
* Key Levels:
* Support: 501.48 / 497.78 / 494.11
* Resistance: 504.46 / 506.77
* Bias:
* 🟢 Bullish above 504.50, expecting breakout toward 510–512.
* 🔴 Bearish below 501.5, likely drop toward 497.8–495.
* Intraday Trading Setup:
* Scalp Long: Entry 504.5–505. Breakout candle confirmation.
* TP: 507. SL: 503.8
* Scalp Short: Entry <501.3
* TP: 498, SL: 503
* Swing Trade Scenario:
* Enter swing calls above 507. Hold for 515+ next week.
* Enter puts only if breakdown below 497.8 with CHoCH back down.
🎯 Final Thoughts:
MSFT is trading tightly below a significant GEX Call Wall, which often leads to a volatile breakout or strong rejection. If bulls push through 507+, we could see a sharp gamma squeeze into 510–515. However, if this fails, price may fade back toward 495–490 zone quickly. Patience at resistance is key.
Disclaimer: This analysis is for educational purposes only and does not constitute financial advice. Always do your own research and manage risk appropriately.
Disclaimer
The information and publications are not meant to be, and do not constitute, financial, investment, trading, or other types of advice or recommendations supplied or endorsed by TradingView. Read more in the Terms of Use.
Disclaimer
The information and publications are not meant to be, and do not constitute, financial, investment, trading, or other types of advice or recommendations supplied or endorsed by TradingView. Read more in the Terms of Use.