TradingView Idea: MSI (Motorola Solutions) – Technical Breakout with Fundamental Context
📈 Trade Setup
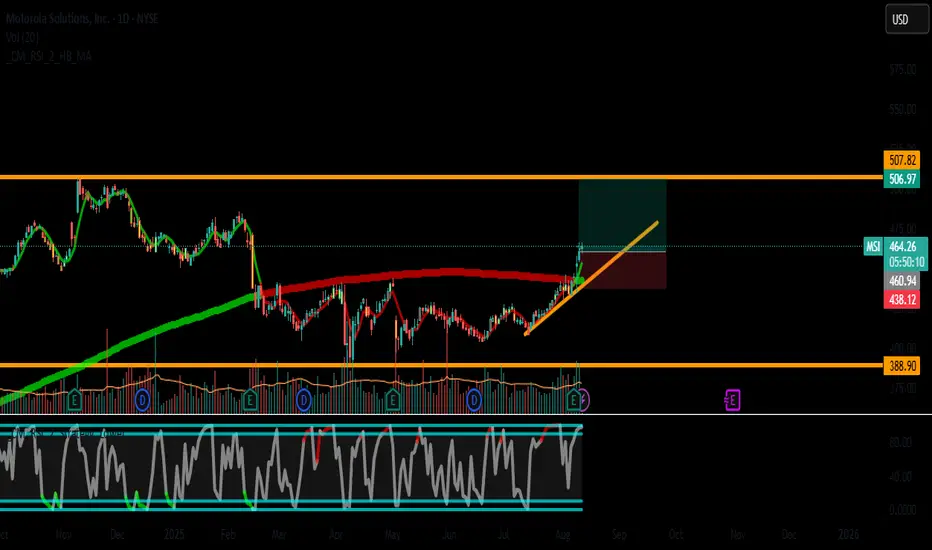
Symbol: MSI (NYSE)
Timeframe: Daily
Entry: $465 (breakout above consolidation)
Stop Loss: $439 (below 50-day SMA)
Take Profit: $507.8 (measured move target)
Risk/Reward: 1:1.6 (5.6% risk | 9.2% reward)
🔍 Technical Analysis
Price Action:
Consolidating between $450-$465 for 2 weeks (bullish pennant).
Breakout above $465 with volume >1.5M shares confirms momentum.
Indicators:
RSI(14): 74 (overbought but holding strong in uptrend).
MACD: Bullish crossover above signal line.
Moving Averages: SMA 20 > SMA 50 > SMA 200 (golden cross).
Trend:
Higher highs/lows since Q2 2025.
No recent RSI2 Connors signals, but price respects bullish structure.
📊 Fundamental Analysis
Valuation:
P/E: 37.1 (sector avg: ~25) → Overvalued.
P/S: 6.9 (sector avg: ~3.5) → Premium pricing.
Debt: Moderate (Debt/Equity: 3.3 | Interest Coverage: 8.1).
Growth: Weak revenue growth (+3.5% YoY) but strong margins.
Dividend: 1.2% yield (low for sector).
Key Risk: High valuation limits upside if earnings disappoint.
⚡ Trade Execution
Entry: Wait for close above $465 with elevated volume.
Position Size: Risk ≤1-2% of capital.
Profit Taking:
50% at $490 (prior resistance).
50% at $507.8 (target).
Stop Management: Trail to breakeven at $475.
🎯 Why This Trade Works
Technical Strength: Breakout with volume support.
Sector Tailwinds: Demand for public safety tech (5G/AI adoption).
Institutional Support: 90% institutional ownership (low float volatility).
⚠️ Risks:
Overbought RSI → Potential pullback.
Next earnings date: Aug 25 (avoid holding through event).
📌 Chart Notes
Key Levels:
Support: $439 (SMA 50) → Critical for invalidation.
Resistance: $490 → First profit zone.
Indicators to Watch: MACD histogram for momentum shifts.
#MSI #BreakoutTrade #TechStocks
Like if you’d take this trade! Comments welcome below.
📌 Disclaimer:
This is not financial advice. Trading carries risks. Past performance ≠ future results. Conduct your own analysis before investing. Motorola Solutions is overvalued fundamentally—this trade is purely technical. Manage risk accordingly.
Discussion:
Would you prioritize technicals over fundamentals here?
How do you trade overbought RSI in strong trends?
📈 Trade Setup
Symbol: MSI (NYSE)
Timeframe: Daily
Entry: $465 (breakout above consolidation)
Stop Loss: $439 (below 50-day SMA)
Take Profit: $507.8 (measured move target)
Risk/Reward: 1:1.6 (5.6% risk | 9.2% reward)
🔍 Technical Analysis
Price Action:
Consolidating between $450-$465 for 2 weeks (bullish pennant).
Breakout above $465 with volume >1.5M shares confirms momentum.
Indicators:
RSI(14): 74 (overbought but holding strong in uptrend).
MACD: Bullish crossover above signal line.
Moving Averages: SMA 20 > SMA 50 > SMA 200 (golden cross).
Trend:
Higher highs/lows since Q2 2025.
No recent RSI2 Connors signals, but price respects bullish structure.
📊 Fundamental Analysis
Valuation:
P/E: 37.1 (sector avg: ~25) → Overvalued.
P/S: 6.9 (sector avg: ~3.5) → Premium pricing.
Debt: Moderate (Debt/Equity: 3.3 | Interest Coverage: 8.1).
Growth: Weak revenue growth (+3.5% YoY) but strong margins.
Dividend: 1.2% yield (low for sector).
Key Risk: High valuation limits upside if earnings disappoint.
⚡ Trade Execution
Entry: Wait for close above $465 with elevated volume.
Position Size: Risk ≤1-2% of capital.
Profit Taking:
50% at $490 (prior resistance).
50% at $507.8 (target).
Stop Management: Trail to breakeven at $475.
🎯 Why This Trade Works
Technical Strength: Breakout with volume support.
Sector Tailwinds: Demand for public safety tech (5G/AI adoption).
Institutional Support: 90% institutional ownership (low float volatility).
⚠️ Risks:
Overbought RSI → Potential pullback.
Next earnings date: Aug 25 (avoid holding through event).
📌 Chart Notes
Key Levels:
Support: $439 (SMA 50) → Critical for invalidation.
Resistance: $490 → First profit zone.
Indicators to Watch: MACD histogram for momentum shifts.
#MSI #BreakoutTrade #TechStocks
Like if you’d take this trade! Comments welcome below.
📌 Disclaimer:
This is not financial advice. Trading carries risks. Past performance ≠ future results. Conduct your own analysis before investing. Motorola Solutions is overvalued fundamentally—this trade is purely technical. Manage risk accordingly.
Discussion:
Would you prioritize technicals over fundamentals here?
How do you trade overbought RSI in strong trends?
Disclaimer
The information and publications are not meant to be, and do not constitute, financial, investment, trading, or other types of advice or recommendations supplied or endorsed by TradingView. Read more in the Terms of Use.
Disclaimer
The information and publications are not meant to be, and do not constitute, financial, investment, trading, or other types of advice or recommendations supplied or endorsed by TradingView. Read more in the Terms of Use.