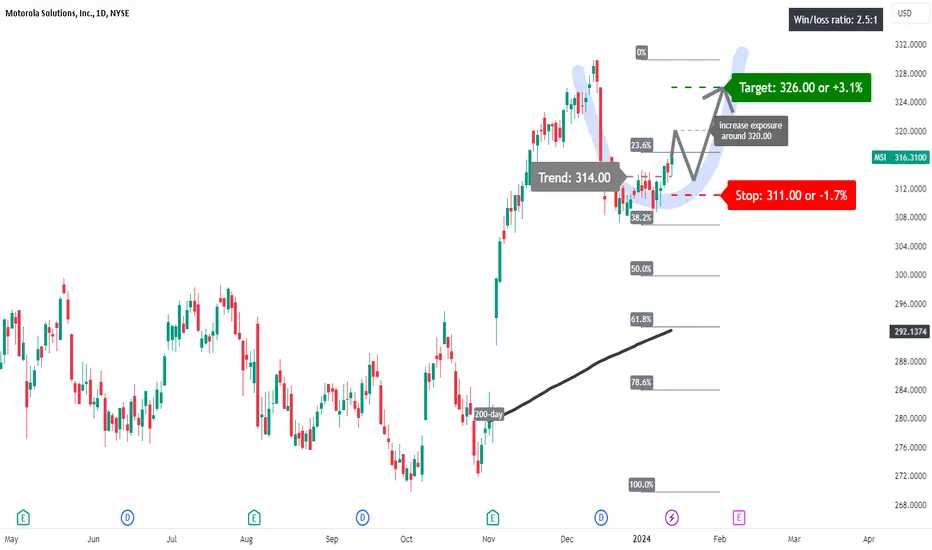
A price action above 314.00 supports a bullish trend direction.
Expect further upside potential for a break above 320.00.
The target price is set at 326.00.
The stop-loss price is set at 311.00.
The U-shaped pattern observed in the price chart may imply a potential for further upward movement in prices. This pattern, often seen as a sign of market recovery or bullish sentiment, suggests that after a period of decline or consolidation, there is a likelihood of price increases as the pattern completes its formation and trends upwards
Disclaimer
The information and publications are not meant to be, and do not constitute, financial, investment, trading, or other types of advice or recommendations supplied or endorsed by TradingView. Read more in the Terms of Use.
Disclaimer
The information and publications are not meant to be, and do not constitute, financial, investment, trading, or other types of advice or recommendations supplied or endorsed by TradingView. Read more in the Terms of Use.