#MSTC, #Bullish, #NSEStocks, #Breakout, #ChartAnalysis
 MSTCLTD is showing a strong bullish setup on the daily/weekly chart.
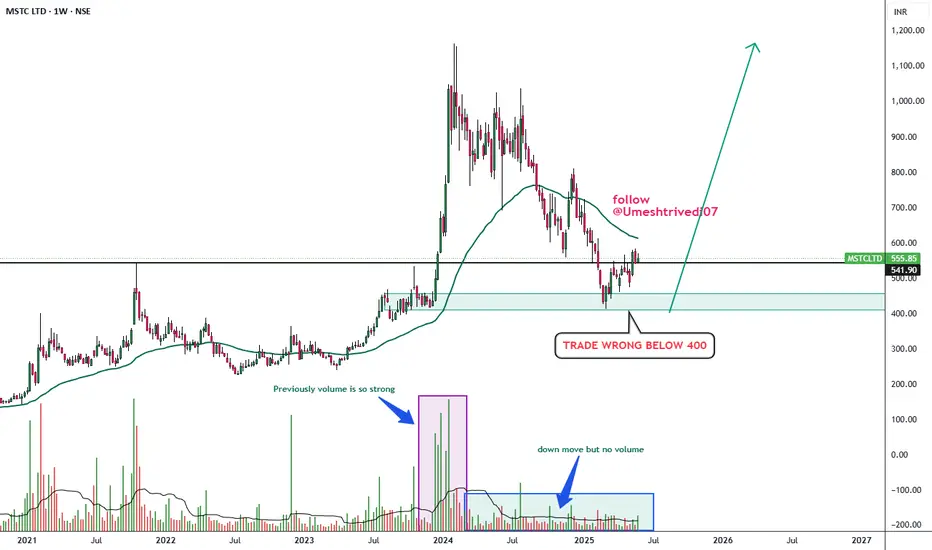
After a period of consolidation, the stock has formed a solid base around ₹[450-500]. The recent price action suggests accumulation, with higher lows and strong volume on green candles.
FUNDAMENTALY ALSO LOOKS GOOD.
⚠️ Disclaimer:
This analysis is for educational and informational purposes only and should not be considered as financial advice. Always do your own research and consult with a qualified financial advisor before making any investment decisions. Trading and investing involve risk, and past performance is not indicative of future results.
Disclaimer
The information and publications are not meant to be, and do not constitute, financial, investment, trading, or other types of advice or recommendations supplied or endorsed by TradingView. Read more in the Terms of Use.
Disclaimer
The information and publications are not meant to be, and do not constitute, financial, investment, trading, or other types of advice or recommendations supplied or endorsed by TradingView. Read more in the Terms of Use.