This analysis focuses on the daily chart of MicroStrategy (MSTR), highlighting significant price action, identified patterns, and predefined support and resistance levels.
Price Action Overview:
Key Levels Identified:
Current Observations:
Disclaimer:
The information provided in this chart is for educational and informational purposes only and should not be considered as investment advice. Trading and investing involve substantial risk and are not suitable for every investor. You should carefully consider your financial situation and consult with a financial advisor before making any investment decisions. The creator of this chart does not guarantee any specific outcome or profit and is not responsible for any losses incurred as a result of using this information. Past performance is not indicative of future results. Use this information at your own risk. This chart has been created for my own improvement in Trading and Investment Analysis. Please do your own analysis before any investments.
Price Action Overview:
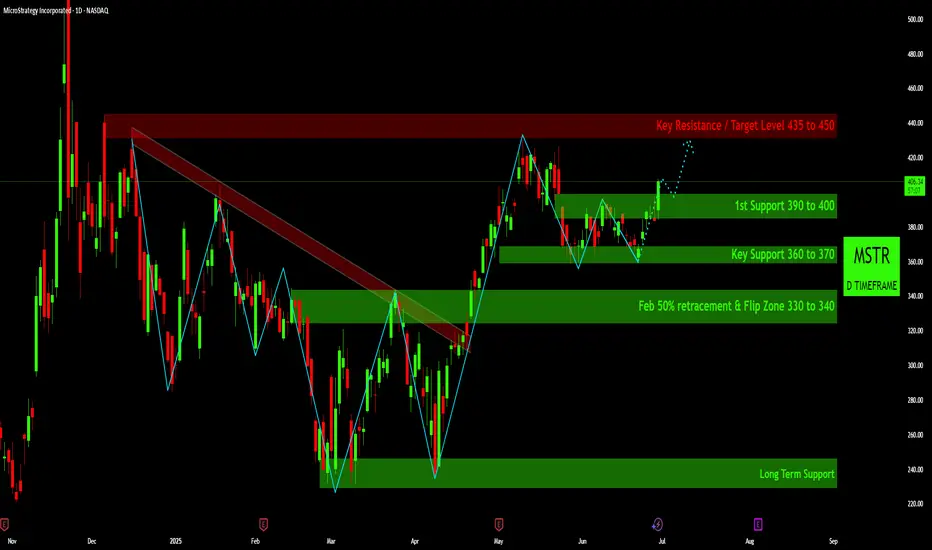
- Starting from late 2024/early 2025, MSTR experienced a notable downtrend, characterized by a series of lower highs and lower lows, leading to a test of the "Strong Support" zone, illustrated by the grey shaded area around the 230-240 price level.
- Following this decline, the chart illustrates a distinct "W" pattern formation, often interpreted as a potential bullish reversal signal. This pattern culminated in a decisive breakout above the overhead descending trendline (marked in red), indicating a shift in market structure from downtrend to a more bullish posture.
- Post-breakout, the price saw a strong upward move into May. A subsequent pullback found significant support within the "Key Support 360 to 370" zone, which appears to have acted as a crucial pivot point, preventing further decline. More recently, the price has consolidated and is current
Key Levels Identified:
- Key Resistance / Target Level (435 to 450): The red shaded area at the top represents a significant overhead resistance zone. This level aligns with a previous peak and is identified as a potential target if the current upward momentum continues.
- 1st Support (390 to 400): This green shaded area serves as the immediate support level. The price has recently traded above this zone, suggesting it has transitioned into a new support area after potentially acting as resistance previously. Sustaining price action above this level would be a key observation.
- Key Support (360 to 370): Located below the first support, this green zone has demonstrated its importance in recent price action, coinciding with the lows seen in June, where buyers stepped in.
- Feb 50% Retracement & Flip Zone (330 to 340): This lower green shaded area represents a significant structural level, identified as a potential 50% Fibonacci retracement level from a previous move and a historical "flip zone" where price action shifted between support and resistance.
- Strong Support (approx. 230-240): The grey shaded box at the bottom indicates a strong historical support level, representing the lowest point observed within this timeframe, acting as a critical long-term floor.
Current Observations:
Disclaimer:
The information provided in this chart is for educational and informational purposes only and should not be considered as investment advice. Trading and investing involve substantial risk and are not suitable for every investor. You should carefully consider your financial situation and consult with a financial advisor before making any investment decisions. The creator of this chart does not guarantee any specific outcome or profit and is not responsible for any losses incurred as a result of using this information. Past performance is not indicative of future results. Use this information at your own risk. This chart has been created for my own improvement in Trading and Investment Analysis. Please do your own analysis before any investments.
Disclaimer
The information and publications are not meant to be, and do not constitute, financial, investment, trading, or other types of advice or recommendations supplied or endorsed by TradingView. Read more in the Terms of Use.
Disclaimer
The information and publications are not meant to be, and do not constitute, financial, investment, trading, or other types of advice or recommendations supplied or endorsed by TradingView. Read more in the Terms of Use.