📊 Market Breakdown
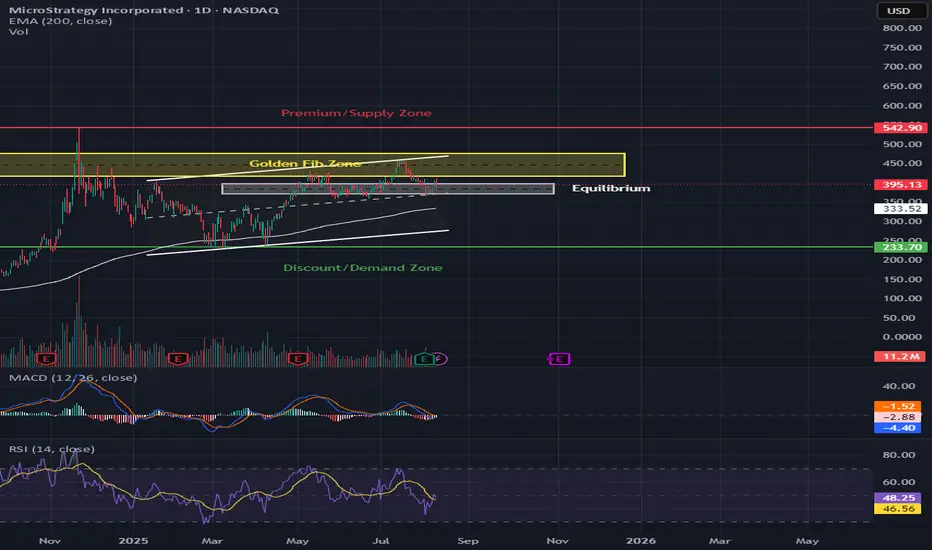
MSTR is trading at $395.13, sitting right on the edge of the Golden Fib Zone ($395–$460) after recently failing to push through resistance. Price is holding above the equilibrium (~$333) for now, but with RSI cooling from overbought 74.41 and MACD momentum turning down, the next few sessions will decide if we bounce or break.
Trend: Strong bullish trend from 2024 lows, but recent price action shows consolidation near the top.
Key Structure: Holding above equilibrium keeps the bullish structure intact, but a close below $395 risks a drop toward $333 support.
Volume: Lighter compared to recent rallies, suggesting buying pressure is slowing.
Indicators:
MACD: Bearish crossover forming.
RSI: 66.85 – coming down from overbought, showing cooling momentum.
🛒 CALLS (Bullish Scenario)
Buy Zones:
🎯 Aggressive Entry: Hold above $395 with bullish daily candle
✅ Confirmation Entry: Break & close above $420
Take Profits:
1️⃣ $450 – Golden Fib Zone top
2️⃣ $490 – Minor resistance before supply
3️⃣ $542 – Premium/Supply Zone target
Stop-Loss: $385
Why This Works: Holding $395 and breaking $420 could spark a push back into the high $400s within 2–3 weeks.
🛑 PUTS (Bearish Scenario)
Sell Zones:
🚨 Aggressive Entry: Daily close below $395
📉 Breakdown Entry: Drop under $385 with momentum
Take Profits:
1️⃣ $333 – Equilibrium zone
2️⃣ $300 – Psychological support
3️⃣ $233 – Discount/Demand Zone
Stop-Loss: $410
Why This Works: Losing $395 puts MSTR at risk for a quick trip to $333, and possibly lower, as momentum shifts bearish.
🔍 Technical Highlights
Golden Fib Zone Test: This level is a decision point — bounce here is bullish, but a close below turns the chart bearish short-term.
Macro Watch: MSTR is heavily tied to Bitcoin’s price movement — BTC weakness = MSTR weakness.
⏳ Option Expiration Strategy:
1 Week: Short-term bounce or rejection plays around $395
2–3 Weeks: Swing toward either $450+ or $333 depending on breakout direction
Disclaimer
The information and publications are not meant to be, and do not constitute, financial, investment, trading, or other types of advice or recommendations supplied or endorsed by TradingView. Read more in the Terms of Use.
Disclaimer
The information and publications are not meant to be, and do not constitute, financial, investment, trading, or other types of advice or recommendations supplied or endorsed by TradingView. Read more in the Terms of Use.