Market Structure & Price Action
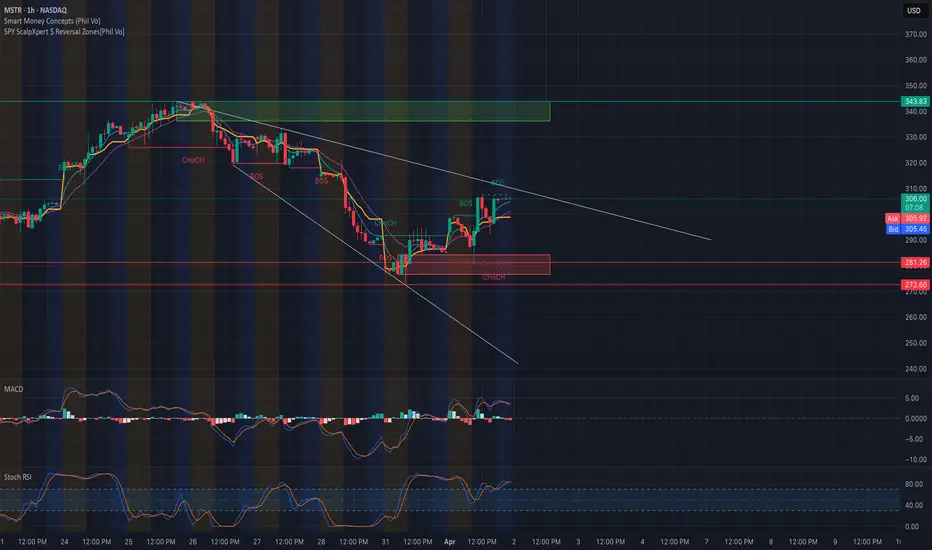
MSTR has recently formed multiple Break of Structure (BOS) and Change of Character (CHoCH) signals, suggesting a power struggle between bulls and bears. The chart currently shows price climbing into a descending trendline and pressing right up against key resistance near the $307 zone after rejecting the CHoCH zone from below.
* BOS confirms bullish intent, but it's climbing within a falling wedge, creating a potential breakout setup.
* Support held strong at $272 and $281, forming a higher low structure with growing bullish momentum.
Trendlines
* The falling wedge pattern is a bullish reversal pattern. Price is nearing the apex—expect volatility and potential breakout in either direction.
* A breakout above $307 with strong volume could trigger a squeeze toward $320–$344.
* Breakdown below the rising trendline near $297 could invite downside liquidity grabs.
Indicators Analysis
* MACD is showing bullish cross momentum, but it’s flattening—momentum is not strong yet.
* Stoch RSI is approaching the overbought zone, indicating a short-term pullback could occur before a true breakout.
Key Levels
* Support: $297 / $281 / $272
* Resistance: $307 / $320 / $344
* Reversal Zone: $272–$281 demand zone still valid if price drops.
Options GEX Sentiment

* GEX Walls are stacked around $325 and $344, signaling heavy call positioning—possible magnet if momentum confirms.
* IVR: 25.7 (low but rising)
* Call%: 42.6%
* IVx vs Avg IVx: +9.23% suggests bullish bets are heating up.
* GEX: Green across the board — bullish gamma tilt.
This GEX alignment suggests a call-dominant environment, especially above $307, increasing the probability of a gamma squeeze toward $320+ if bulls sustain pressure.
Trade Ideas
* Bullish Scenario: Long above $307 breakout with volume. Targets: $320, $344.
* Bearish Scenario: Short below $297 breakdown or wick rejection at $307. Targets: $281 / $272.
Conclusion MSTR is coiling at resistance with bullish signals building. If it breaks $307 with volume, there’s room for a sharp move higher supported by strong call walls and GEX. However, fading momentum or a fakeout at this level can lead to a pullback to $281 or lower.
📌 Watch the volume and MACD for confirmation before entering either side.
Disclaimer: This analysis is for educational purposes only. Not financial advice. Always do your own research and manage risk accordingly.
* BOS confirms bullish intent, but it's climbing within a falling wedge, creating a potential breakout setup.
* Support held strong at $272 and $281, forming a higher low structure with growing bullish momentum.
Trendlines
* The falling wedge pattern is a bullish reversal pattern. Price is nearing the apex—expect volatility and potential breakout in either direction.
* A breakout above $307 with strong volume could trigger a squeeze toward $320–$344.
* Breakdown below the rising trendline near $297 could invite downside liquidity grabs.
Indicators Analysis
* MACD is showing bullish cross momentum, but it’s flattening—momentum is not strong yet.
* Stoch RSI is approaching the overbought zone, indicating a short-term pullback could occur before a true breakout.
Key Levels
* Support: $297 / $281 / $272
* Resistance: $307 / $320 / $344
* Reversal Zone: $272–$281 demand zone still valid if price drops.
Options GEX Sentiment
* GEX Walls are stacked around $325 and $344, signaling heavy call positioning—possible magnet if momentum confirms.
* IVR: 25.7 (low but rising)
* Call%: 42.6%
* IVx vs Avg IVx: +9.23% suggests bullish bets are heating up.
* GEX: Green across the board — bullish gamma tilt.
This GEX alignment suggests a call-dominant environment, especially above $307, increasing the probability of a gamma squeeze toward $320+ if bulls sustain pressure.
Trade Ideas
* Bullish Scenario: Long above $307 breakout with volume. Targets: $320, $344.
* Bearish Scenario: Short below $297 breakdown or wick rejection at $307. Targets: $281 / $272.
Conclusion MSTR is coiling at resistance with bullish signals building. If it breaks $307 with volume, there’s room for a sharp move higher supported by strong call walls and GEX. However, fading momentum or a fakeout at this level can lead to a pullback to $281 or lower.
📌 Watch the volume and MACD for confirmation before entering either side.
Disclaimer: This analysis is for educational purposes only. Not financial advice. Always do your own research and manage risk accordingly.
Disclaimer
The information and publications are not meant to be, and do not constitute, financial, investment, trading, or other types of advice or recommendations supplied or endorsed by TradingView. Read more in the Terms of Use.
Disclaimer
The information and publications are not meant to be, and do not constitute, financial, investment, trading, or other types of advice or recommendations supplied or endorsed by TradingView. Read more in the Terms of Use.