Before we begin... trading view is restricting my post for an indicator.. maybe someone reported it... not sure... doesn't seem like a problem... it's a TD Sequential ...
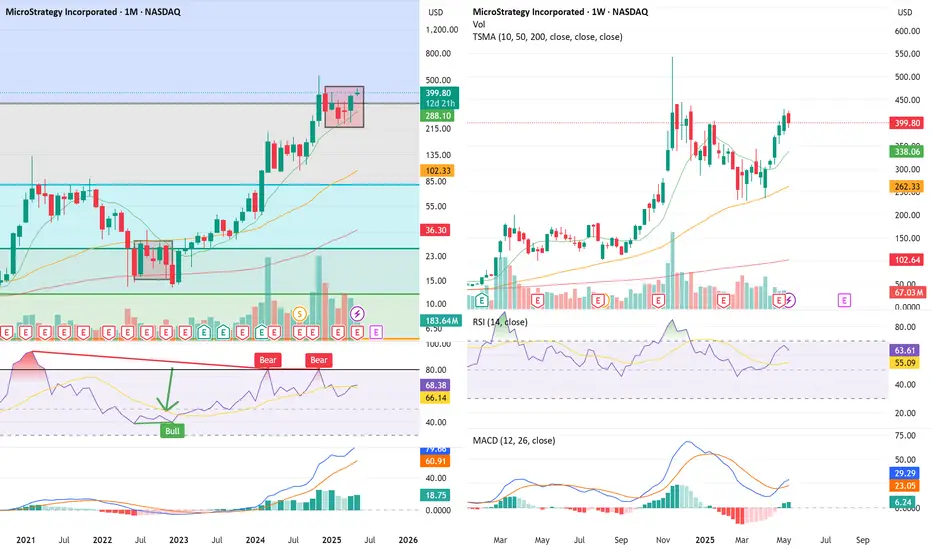
🔍 The Setup — Monthly “Backwards 4” Pattern + Multi-Timeframe Breakdown
We’re now forming the 5th candle in what I call the “Backwards 4” formation, or the upside-down lowercase ‘h’ — a recurring reversal structure I’ve tracked at macro tops.
Structure breakdown:
✅ Strong monthly green candle
2–3. 🔻 Two red candles that retrace the body but don’t break it
✅ A second green candle that re-tests the highs and baits breakout buyers
❌ Final candle closes red → confirms exhaustion → multi-month drawdown begins
We saw this exact setup in early 2021 before MSTR collapsed from $1,000+ to $134. The pattern is now repeating — but this time it’s backed by RSI + MACD divergences on all major timeframes.
📊 Multi-Timeframe Technical Breakdown
📆 Monthly
Inside the “Backwards 4” zone now (candle 5)
RSI Bear Divergence: price made new highs but RSI keeps printing lower highs
MACD flattening after extended expansion
Volume fading for 3 months straight
📌 Momentum is dying while price floats. That’s not strength — that’s late-cycle distribution.
📆 Weekly
TD9 printed this week at the top of a tight 5-month box
RSI rejected at 63.61 — exact same rejection level as last cycle highs
MACD histogram curling while price stayed flat
Range: ~$338–$430 → energy has been spent
📌 This isn’t breakout behavior — it’s a liquidity trap.
📆 Daily
Double top attempt failed at $406
MACD crossed bearish, histogram turning red
RSI Bear Divergence Confirmed:
Price made higher highs from April to May
RSI made lower highs, tagging 66.90 vs. 74.70 earlier this year
📌 Daily has now logged 3 bearish RSI divergence peaks since February.
📋 Trading Plan (as of May 17, 2025)
Position: No current short — stalking ideal entry
Entry Zone: $406–$410 rejection zone (upper box resistance)
Trigger: Daily close under $390 confirms failed breakout
Add Confirmation: Weekly close under $375 = trend shift
Stop: Above $430 monthly high (invalidates breakout fade)
Target 1: $320–$290 (May red close zone)
Target 2: $262 (range midpoint / fib retrace)
Target 3: $240 (prior base support)
Stretch Targets: $175 and $102 if macro breaks down
Waiting for clean structure breakdown before initiating core position. This is a setup worth being early but precise on.
🧠 Final Thoughts:
This is one of my highest conviction macro top setups.
The “Backwards 4” is showing up again with RSI and MACD fading across the board. Price is floating under resistance on weakening momentum, and volume confirms it.
If May closes red, we likely begin a multi-month correction.
I’m watching for the breakdown trigger under $390 to begin building short exposure, targeting sub-$300 by month-end and lower into summer if momentum continues to unwind.
📉📦 Let’s see how it finishes.
Related publications
Disclaimer
The information and publications are not meant to be, and do not constitute, financial, investment, trading, or other types of advice or recommendations supplied or endorsed by TradingView. Read more in the Terms of Use.
Related publications
Disclaimer
The information and publications are not meant to be, and do not constitute, financial, investment, trading, or other types of advice or recommendations supplied or endorsed by TradingView. Read more in the Terms of Use.