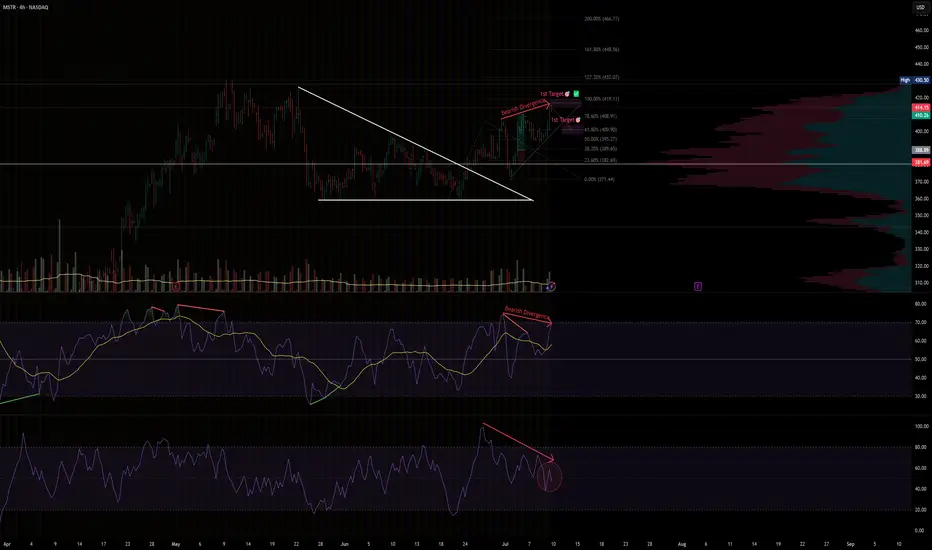
Setup Breakdown
Price recently broke out from a falling wedge and hit both technical targets — first at ~$409 (78.6%) and then ~$419 (100%).
However, momentum is weakening despite price hovering near the highs.
We're now seeing early bearish divergence on multiple timeframes and oscillators, signaling potential reversal or pullback.
⚠️ Bearish Signals
RSI Divergence
Price made higher highs while RSI made lower highs — classic bearish divergence.
Double confirmation
Both RSI with MA and pure RSI show declining momentum.
Volume drop
Price is rising but volume is not following — another early warning sign.
🔻 Potential Breakdown Trigger
If price closes below $407–405, that would break short-term structure and confirm the divergence risk.
Watch for RSI to drop below 50 and volume to spike on red candles — that would likely accelerate the correction.
📉 Downside Zones to Watch
$400
=> 61.8% Fib retracement + consolidation base
$395
=> 50% Fib retracement
$389
=> 38.2% Fib retracement + prior breakout support
✅ Summary
Divergence is still early but meaningful — momentum does not support current price highs.
A breakdown from current levels could open a short window down to $386 or even $371 if confirmed.
Watch RSI + volume + candle structure for confirmation before acting.
Disclaimer: This is not financial advice. Always manage your own risk and follow your trading plan.
#MSTR #BearishDivergence #RSI #Fibonacci #MomentumShift #VolumeAnalysis #TradingView #TechStocks #4HChart
VM
Disclaimer
The information and publications are not meant to be, and do not constitute, financial, investment, trading, or other types of advice or recommendations supplied or endorsed by TradingView. Read more in the Terms of Use.
Disclaimer
The information and publications are not meant to be, and do not constitute, financial, investment, trading, or other types of advice or recommendations supplied or endorsed by TradingView. Read more in the Terms of Use.