Let's perform a technical analysis of MicroStrategy (MSTR) stock, focusing on Time-based Fibonacci analysis, the potential for a Cup and Handle pattern with a 50% upside target, and briefly touching on Williams Alligator strength.
As of Friday, June 27, 2025, at 9:36:57 PM PDT, here's an analysis of MSTR:
**Current Price & Performance:**
* **Last Price:** $383.88 (as of 4:00 PM ET on June 27, 2025)
* **Today's Change:** Down $2.75 (-0.71%)
* **After-hours price:** $384.45 (up 0.14% as of 7:59 PM ET on June 27, 2025)
* **Previous Close:** $386.63
* **Today's Range:** $383.41 - $397.99
* **52-Week Range:** $102.40 - $543.00 (Note: MSTR reached its all-time high on Nov 20, 2024, at $543.00)
---
### **Time-Based Fibonacci Analysis**
Time-based Fibonacci analysis (also known as Fibonacci Time Zones or Time Extensions) aims to predict future points in time where significant price reversals or changes in trend *might* occur. Unlike price-based Fibonacci retracements/extensions, which focus on price levels, time-based Fibs are vertical lines drawn on the chart at specific intervals (Fibonacci numbers like 1, 2, 3, 5, 8, 13, 21, 34, etc.) from a significant swing high or low.
**How to apply (Conceptually):**
1. **Identify Key Swing Points:** You would select two significant swing points (e.g., a major low and a subsequent high, or vice versa) on the daily chart.
2. **Draw the Zones:** The charting software then draws vertical lines at time intervals corresponding to Fibonacci numbers from that starting point.
**Interpretation for MSTR (Conceptual):**
Given MSTR's highly volatile nature and strong correlation to Bitcoin, applying time-based Fibonacci is more speculative than price-based methods. However, if we were to apply it:
* **Starting Point:** A logical starting point could be a significant low where a new uptrend began (e.g., the 52-week low of $102.40 from July 2024). Another key point could be a major turning point, like the all-time high of $543.00 in November 2024.
* **Potential Relevance:** The vertical lines at Fibonacci intervals after these points *could* indicate periods where MSTR's momentum might shift, or a new leg of a trend might begin/end.
* **Current State:** Without knowing the exact start points used, it's hard to pinpoint specific upcoming time targets. However, if MSTR is currently in a consolidation phase (as suggested by the Cup and Handle discussion), a time-based Fibonacci analysis might highlight a potential *date range* when this consolidation could end, and a new trending move might initiate. It's often said that "something" is likely to happen "at" or "near" these time points, whether a reversal, acceleration, or consolidation.
**Important Note on Time-Based Fibs:** They are often considered more subjective and less precise than price-based Fibonaccis. They are best used as a confluence tool with other indicators.
---
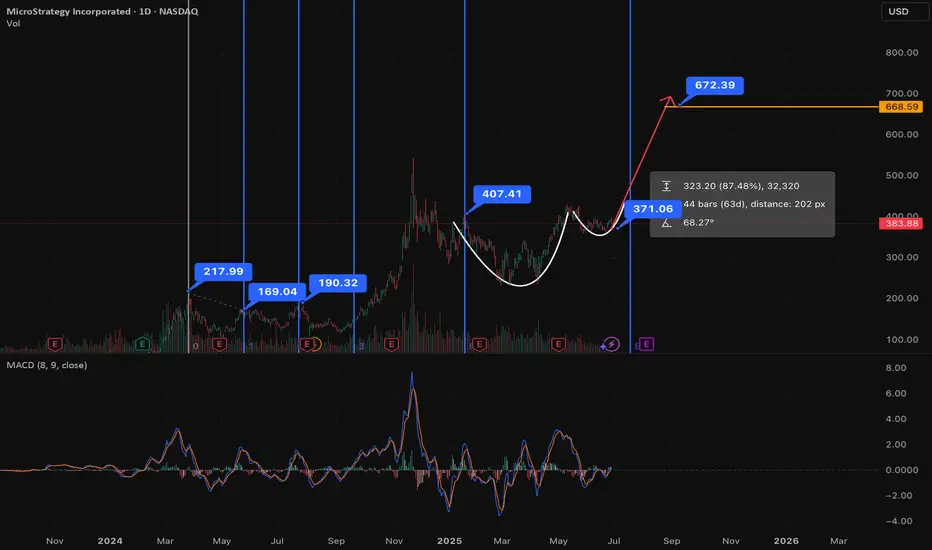
### **Cup and Handle Forming for 50% Upside**
A "Cup and Handle" is a bullish continuation pattern that signals a period of consolidation followed by a potential breakout.
* **The "Cup":** A "U" shaped formation where the price declines, bottoms out, and then rises back to approximately the original level. The cup's formation can range from 1 to 6 months.
* **The "Handle":** A smaller, shorter consolidation pattern (often a flag or pennant) that forms on the right side of the cup, typically with a slight downward drift. The handle typically lasts 1 to 4 weeks and should form in the top half of the cup.
* **Breakout:** A decisive move above the resistance level created by the top of the cup and handle, on increased volume, confirms the pattern.
**MSTR - Is a Cup and Handle Forming?**
Recent analysis has indeed highlighted the potential for a Cup and Handle formation on MSTR's chart. This implies:
* **The "Cup":** MSTR saw a significant run-up to its all-time high of $543.00 in November 2024, followed by a pullback and then a recovery, potentially forming the "U" shape of a large cup. The stock's journey from its 52-week low of $102.40 to its high and subsequent retracement/recovery could be outlining this larger cup. The duration of this "cup" would be several months.
* **The "Handle":** The current price action (around $383.88) comes after MSTR has seen a recovery from its lows, but is still significantly below its all-time high. The consolidation MSTR has been experiencing in recent weeks/months after its peak (e.g., trading between roughly $300 and $400 or higher) could be forming the "handle" of this larger pattern.
**50% Upside Target:**
The upside target for a Cup and Handle pattern is typically measured by the *depth of the cup* projected upwards from the breakout point.
* **Depth of the Cup:** If we consider the peak of the cup around $543 and a significant low point (perhaps the bottom of the "U" around $300-$350), the depth could be substantial (e.g., $543 - $300 = $243).
* **Breakout Level:** The breakout level would be the previous high of the "cup" (around $543.00).
* **Projected Target:** If we use a depth of, say, $243, and add it to the breakout level of $543, that would imply a target around $786. This figure is significantly higher than the current price of $383.88.
A 50% upside from the current price of $383.88 would put the target at approximately **$575.82**. This target is plausible within the context of a Cup and Handle breakout, especially if the cup's depth and the breakout confirm such a move. Reaching $575.82 would also put MSTR above its previous all-time high, indicating a new phase of price discovery.
**Confirmation:** For this pattern to be confirmed, MSTR would need to:
1. Continue forming a clear "handle" consolidation without breaking down significantly.
2. Break out convincingly above the resistance level (the rim of the cup, potentially around the $500-$540 range) on strong volume.
---
### **Williams Alligator Strength (Daily Chart)**
The Williams Alligator consists of three smoothed moving averages: Lips (Green, 5-period), Teeth (Red, 8-period), and Jaw (Blue, 13-period).
**MSTR's Alligator State:**
* MSTR has experienced significant volatility and swings. After its all-time high in November 2024, it saw a substantial correction, meaning the Alligator's mouth would have likely been open downwards (Blue > Red > Green).
* More recently, MSTR has been in a recovery/consolidation phase.
* **Current State:** Given today's slight down day (-0.71%), and the general consolidation, the Alligator's lines are likely **converging or intertwined ("sleeping")**. This indicates a non-trending period or sideways movement, where the price is consolidating its recent gains or losses.
* **Strength:** When the Alligator is "sleeping," it signals a lack of strong directional conviction. The strength is neutral or weakening from a previous trend. For a strong uptrend to resume (and for the Cup and Handle to break out), the Alligator's mouth would need to "awaken" and open upwards (Green > Red > Blue) on increasing volume.
---
### **Overall Conclusion for MSTR:**
MicroStrategy is a highly unique stock due to its significant Bitcoin holdings, which heavily influence its price action.
* **Cup and Handle:** There is a compelling argument for a large **Cup and Handle pattern forming** on the daily chart. The implied 50% upside target from the current price, which would take it beyond its previous all-time high, makes this a very interesting setup. Confirmation of this pattern will require a clear breakout above the cup's resistance on strong volume.
* **Time-Based Fibonacci:** While more subjective, time-based Fibonacci could provide insight into potential *timing* of trend changes or the end of the current consolidation, which would be crucial for a Cup and Handle breakout.
* **Williams Alligator:** The Alligator is likely in a **"sleeping" or consolidating phase**, indicating current indecision or sideways movement. For the bullish Cup and Handle to materialize, the Alligator would need to "awaken" and confirm the new upward trend.
**Important Considerations:**
* **Bitcoin Correlation:** MSTR's price is highly correlated to Bitcoin's performance. Any significant moves in Bitcoin will heavily impact MSTR.
* **Volatility:** MSTR is a highly volatile stock.
* **Risk Management:** Always exercise prudent risk management and consider your investment goals.
This analysis provides a technical perspective; it is not financial advice. Always conduct your own comprehensive research and consult with a qualified financial advisor before making any investment decisions.
As of Friday, June 27, 2025, at 9:36:57 PM PDT, here's an analysis of MSTR:
**Current Price & Performance:**
* **Last Price:** $383.88 (as of 4:00 PM ET on June 27, 2025)
* **Today's Change:** Down $2.75 (-0.71%)
* **After-hours price:** $384.45 (up 0.14% as of 7:59 PM ET on June 27, 2025)
* **Previous Close:** $386.63
* **Today's Range:** $383.41 - $397.99
* **52-Week Range:** $102.40 - $543.00 (Note: MSTR reached its all-time high on Nov 20, 2024, at $543.00)
---
### **Time-Based Fibonacci Analysis**
Time-based Fibonacci analysis (also known as Fibonacci Time Zones or Time Extensions) aims to predict future points in time where significant price reversals or changes in trend *might* occur. Unlike price-based Fibonacci retracements/extensions, which focus on price levels, time-based Fibs are vertical lines drawn on the chart at specific intervals (Fibonacci numbers like 1, 2, 3, 5, 8, 13, 21, 34, etc.) from a significant swing high or low.
**How to apply (Conceptually):**
1. **Identify Key Swing Points:** You would select two significant swing points (e.g., a major low and a subsequent high, or vice versa) on the daily chart.
2. **Draw the Zones:** The charting software then draws vertical lines at time intervals corresponding to Fibonacci numbers from that starting point.
**Interpretation for MSTR (Conceptual):**
Given MSTR's highly volatile nature and strong correlation to Bitcoin, applying time-based Fibonacci is more speculative than price-based methods. However, if we were to apply it:
* **Starting Point:** A logical starting point could be a significant low where a new uptrend began (e.g., the 52-week low of $102.40 from July 2024). Another key point could be a major turning point, like the all-time high of $543.00 in November 2024.
* **Potential Relevance:** The vertical lines at Fibonacci intervals after these points *could* indicate periods where MSTR's momentum might shift, or a new leg of a trend might begin/end.
* **Current State:** Without knowing the exact start points used, it's hard to pinpoint specific upcoming time targets. However, if MSTR is currently in a consolidation phase (as suggested by the Cup and Handle discussion), a time-based Fibonacci analysis might highlight a potential *date range* when this consolidation could end, and a new trending move might initiate. It's often said that "something" is likely to happen "at" or "near" these time points, whether a reversal, acceleration, or consolidation.
**Important Note on Time-Based Fibs:** They are often considered more subjective and less precise than price-based Fibonaccis. They are best used as a confluence tool with other indicators.
---
### **Cup and Handle Forming for 50% Upside**
A "Cup and Handle" is a bullish continuation pattern that signals a period of consolidation followed by a potential breakout.
* **The "Cup":** A "U" shaped formation where the price declines, bottoms out, and then rises back to approximately the original level. The cup's formation can range from 1 to 6 months.
* **The "Handle":** A smaller, shorter consolidation pattern (often a flag or pennant) that forms on the right side of the cup, typically with a slight downward drift. The handle typically lasts 1 to 4 weeks and should form in the top half of the cup.
* **Breakout:** A decisive move above the resistance level created by the top of the cup and handle, on increased volume, confirms the pattern.
**MSTR - Is a Cup and Handle Forming?**
Recent analysis has indeed highlighted the potential for a Cup and Handle formation on MSTR's chart. This implies:
* **The "Cup":** MSTR saw a significant run-up to its all-time high of $543.00 in November 2024, followed by a pullback and then a recovery, potentially forming the "U" shape of a large cup. The stock's journey from its 52-week low of $102.40 to its high and subsequent retracement/recovery could be outlining this larger cup. The duration of this "cup" would be several months.
* **The "Handle":** The current price action (around $383.88) comes after MSTR has seen a recovery from its lows, but is still significantly below its all-time high. The consolidation MSTR has been experiencing in recent weeks/months after its peak (e.g., trading between roughly $300 and $400 or higher) could be forming the "handle" of this larger pattern.
**50% Upside Target:**
The upside target for a Cup and Handle pattern is typically measured by the *depth of the cup* projected upwards from the breakout point.
* **Depth of the Cup:** If we consider the peak of the cup around $543 and a significant low point (perhaps the bottom of the "U" around $300-$350), the depth could be substantial (e.g., $543 - $300 = $243).
* **Breakout Level:** The breakout level would be the previous high of the "cup" (around $543.00).
* **Projected Target:** If we use a depth of, say, $243, and add it to the breakout level of $543, that would imply a target around $786. This figure is significantly higher than the current price of $383.88.
A 50% upside from the current price of $383.88 would put the target at approximately **$575.82**. This target is plausible within the context of a Cup and Handle breakout, especially if the cup's depth and the breakout confirm such a move. Reaching $575.82 would also put MSTR above its previous all-time high, indicating a new phase of price discovery.
**Confirmation:** For this pattern to be confirmed, MSTR would need to:
1. Continue forming a clear "handle" consolidation without breaking down significantly.
2. Break out convincingly above the resistance level (the rim of the cup, potentially around the $500-$540 range) on strong volume.
---
### **Williams Alligator Strength (Daily Chart)**
The Williams Alligator consists of three smoothed moving averages: Lips (Green, 5-period), Teeth (Red, 8-period), and Jaw (Blue, 13-period).
**MSTR's Alligator State:**
* MSTR has experienced significant volatility and swings. After its all-time high in November 2024, it saw a substantial correction, meaning the Alligator's mouth would have likely been open downwards (Blue > Red > Green).
* More recently, MSTR has been in a recovery/consolidation phase.
* **Current State:** Given today's slight down day (-0.71%), and the general consolidation, the Alligator's lines are likely **converging or intertwined ("sleeping")**. This indicates a non-trending period or sideways movement, where the price is consolidating its recent gains or losses.
* **Strength:** When the Alligator is "sleeping," it signals a lack of strong directional conviction. The strength is neutral or weakening from a previous trend. For a strong uptrend to resume (and for the Cup and Handle to break out), the Alligator's mouth would need to "awaken" and open upwards (Green > Red > Blue) on increasing volume.
---
### **Overall Conclusion for MSTR:**
MicroStrategy is a highly unique stock due to its significant Bitcoin holdings, which heavily influence its price action.
* **Cup and Handle:** There is a compelling argument for a large **Cup and Handle pattern forming** on the daily chart. The implied 50% upside target from the current price, which would take it beyond its previous all-time high, makes this a very interesting setup. Confirmation of this pattern will require a clear breakout above the cup's resistance on strong volume.
* **Time-Based Fibonacci:** While more subjective, time-based Fibonacci could provide insight into potential *timing* of trend changes or the end of the current consolidation, which would be crucial for a Cup and Handle breakout.
* **Williams Alligator:** The Alligator is likely in a **"sleeping" or consolidating phase**, indicating current indecision or sideways movement. For the bullish Cup and Handle to materialize, the Alligator would need to "awaken" and confirm the new upward trend.
**Important Considerations:**
* **Bitcoin Correlation:** MSTR's price is highly correlated to Bitcoin's performance. Any significant moves in Bitcoin will heavily impact MSTR.
* **Volatility:** MSTR is a highly volatile stock.
* **Risk Management:** Always exercise prudent risk management and consider your investment goals.
This analysis provides a technical perspective; it is not financial advice. Always conduct your own comprehensive research and consult with a qualified financial advisor before making any investment decisions.
Disclaimer
The information and publications are not meant to be, and do not constitute, financial, investment, trading, or other types of advice or recommendations supplied or endorsed by TradingView. Read more in the Terms of Use.
Disclaimer
The information and publications are not meant to be, and do not constitute, financial, investment, trading, or other types of advice or recommendations supplied or endorsed by TradingView. Read more in the Terms of Use.