MSTU – Sitting Right on a 2H Demand
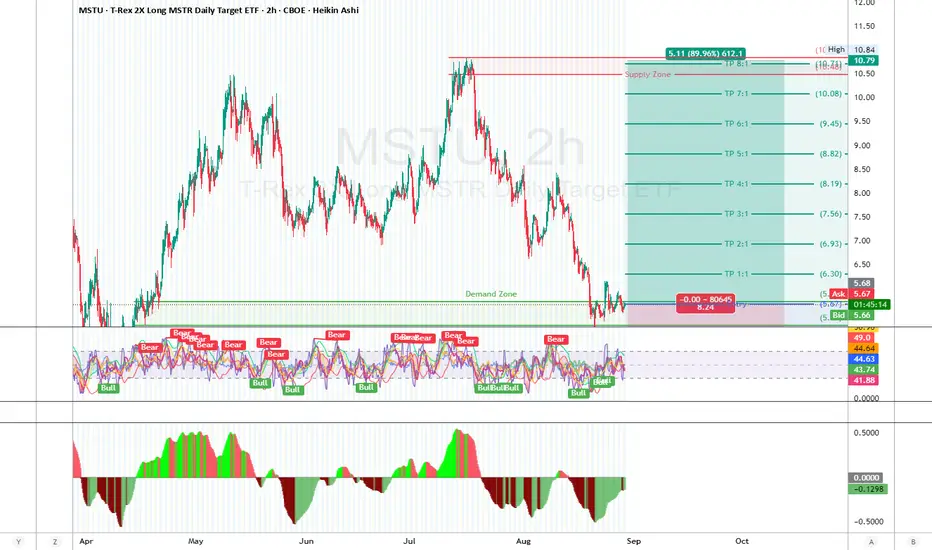
MSTU has been in free fall since that 10.80 peak. Now, it’s parked right at a big demand zone (5.20–5.50) — the same area that held earlier this year.
MSTU is basically a leveraged bet on Bitcoin + MicroStrategy earnings.
MSTR just posted Q2: revenue flat, still net loss, but the big story = they now hold 226,500 BTC at ~$35.3K avg cost.
🟩 Demand Zone
5.20–5.50 → tested multiple times, still holding strong.
🟥 Supply Zone
10.50–10.80 → the area where sellers dumped hard.
RSI/Stoch Signals: After weeks of “Bear” signals, we’re now seeing a string of fresh “Bull” flashes as price stabilizes. Momentum is shifting.
MACD Histogram: Still slightly red, but starting to flatten out. If it flips green, that’s the trigger.
🎯 Trade Setup
Entry: Anywhere 5.50–5.70 (demand zone buy)
Stop Loss: 5.06 (below demand breakdown)
Target: 10.80 (major supply)
Risk/Reward: ~1:8 RR → high payoff if demand holds.
Trade Management
Move stop to Break Even once price clears 7.00.
Scale out partials near 8.50.
Let a runner ride into 10.50–10.80 for the home run.
“The best trades often feel the hardest to take.”
This one? It feels tough to buy because the chart looks wrecked — but that’s often when demand zones do their best work.
⚠️ Disclaimer
This is just my trading plan — not financial advice. MSTU is a leveraged ETF = big upside, but also amplified downside. Size small, manage risk.
By Dubai Traders Hub
Follow us on X , YouTube, and Join our Telegram Channel
Follow us on X , YouTube, and Join our Telegram Channel
Disclaimer
The information and publications are not meant to be, and do not constitute, financial, investment, trading, or other types of advice or recommendations supplied or endorsed by TradingView. Read more in the Terms of Use.