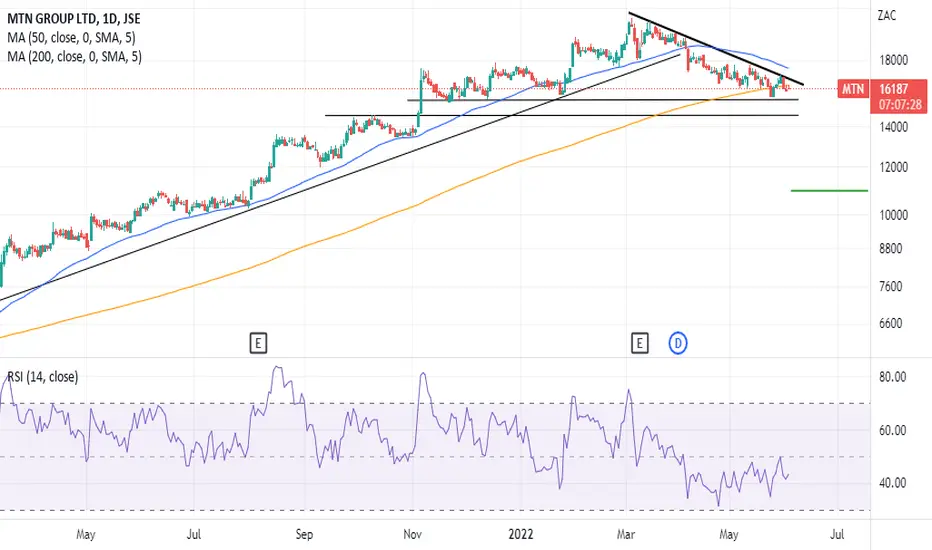
MTN making a series of low-highs, and developing a bearish descending triangle chart pattern in the process.
If confirmed this may take price to around R110, albeit with some support levels to overcome along the way.
*That down trendline line (currently around 170-175) has to be broken for the uptrend to remain intact and resume.
If confirmed this may take price to around R110, albeit with some support levels to overcome along the way.
*That down trendline line (currently around 170-175) has to be broken for the uptrend to remain intact and resume.
Disclaimer
The information and publications are not meant to be, and do not constitute, financial, investment, trading, or other types of advice or recommendations supplied or endorsed by TradingView. Read more in the Terms of Use.
Disclaimer
The information and publications are not meant to be, and do not constitute, financial, investment, trading, or other types of advice or recommendations supplied or endorsed by TradingView. Read more in the Terms of Use.