Entry conditions:
(i) higher share price for MTS along with swing up of indicators such as DMI/RSI.
Stop loss for the trade would be:
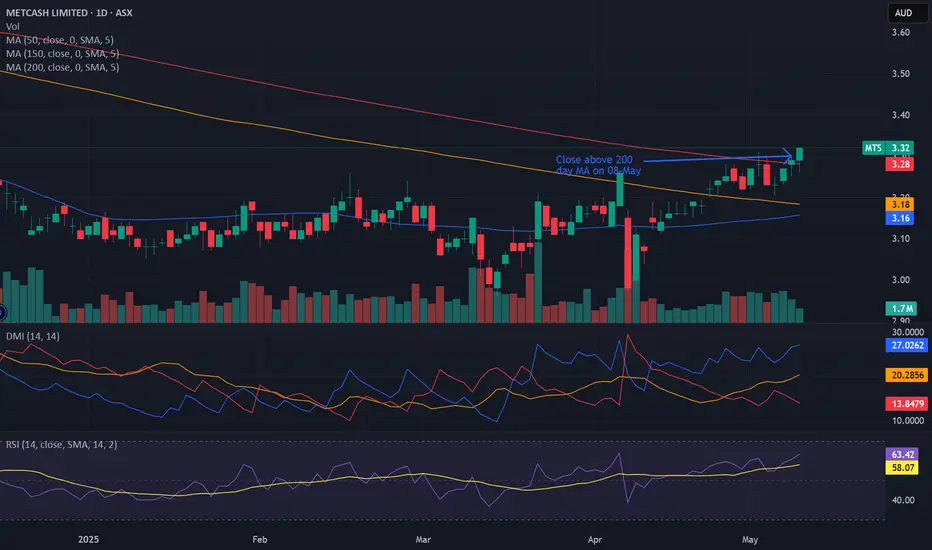
(i) below the recent swing low of 6th May (i.e.: below $3.21), or
(ii) a close below the 50 day moving average (currently $3.16), or
(ii) below the support level from the open of 11th April (i.e.: below $3.12), depending on risk tolerance.
(i) higher share price for
Stop loss for the trade would be:
(i) below the recent swing low of 6th May (i.e.: below $3.21), or
(ii) a close below the 50 day moving average (currently $3.16), or
(ii) below the support level from the open of 11th April (i.e.: below $3.12), depending on risk tolerance.
Trade active
UPDATE (week ending 09-May): Trade activated 9th May with a swing up of DMI and RSI indicators, albeit on fairly low volume, which warrants a bit of caution. The share price closed above both 10 and 30 day MA's at the end of the trading week.Note
UPDATE (week ending 16-May): Share price action formed a higher high and higher low during this trading week, with the share price successfully testing the 200 day MA during the week also. The daily chart suggests tightening the stop to slightly under the recent swing low of 15th May (i.e.: slightly below $3.26).Note
UPDATE (week ending 23-May): Further respect of the 200 day MA was noted during the trading week, with a gap-up in share price noted on Wednesday that provides the opportunity to raise stops aggressively (if so desired) to slightly under the open of 13th May (i.e.: below $3.36 to, say, $3.34) to form a profitable stop in case of failure of the gap, or raise the stop to near breakeven just below the 200 day MA (currently sitting at $3.27). This trade is now considered a 'further bullish potential' trade.Note
UPDATE (week ending 30-May): Consolidation of price action occurred this week for MTS, with the share price closing above both 10 and 30 day MA's at the end of the trading week. No action with respect to this stock suggested following on from last week's note.Note
UPDATE (week ending 06-Jun): The share price action for MTS attempted to breakout to the north side this week but was met with what appears to be resistance from previous levels of interest from the past (the open from 15th December 2023 which was the base of a key reversal bottom formation at $3.42, as well as the open from 6th February 2024 which was the open of a candle where buyers 'bought the dip' during that bull run phase following that key reversal bottom at $3.48). Charts now suggest that the information from two weeks ago is fully taken heed for anyone still in this trade (i.e.: raising stops aggressively in case the sideways channel formed from the gap-up in share price on 21st May fails - e.g.: raising stops to a profitable area at, say, $3.34).Note
UPDATE (week ending 13-Jun): Incredible price action for MTS this week saw a breakout play occuring on both the daily and weekly charts through the $3.43 level of interest that had formed at the high of the 3rd December 2024, so that MTS is now trading at 200 day highs and the trade can now be treated as a retrospective Darvas box play to manage the trade, if so desired. Heading into earnings over the next week (due 23rd June), this would provide a fair amount of 'wiggle room' for those traders/investors wishing to remain in the trade. Alternatively, a good time to book in terrific profits (congratulations!).For traders/investors wishing to utilise the Darvas box strategy to maintain the trade, the initial retrospective Darvas box that could be applied on the daily chart forms around the 3rd December 2024 (high of $3.43) and 14th March 2025 (low of $2.96), with initial stop of $2.95. With newer highs formed during this week, suggestion of the charts would be to place stop at $3.30 ($0.35 above one tick beneath Darvas box formation). Conservative stop remain at $3.34 as discussed last week.
Note
UPDATE (week ending 20-Jun): No newer highs recorded for MTS this week, so no raising of stops in accordance with the Darvas box technique. Share price respected and closed above the 10 day MA at the end of the trading week.Note
UPDATE (week ending 27-Jun): Newer highs formed during the week, with suggestion to raise stop loss to $3.53 ($0.58 above one tick beneath Darvas box). Of interest to note, even though MTS missed earnings estimates during the week, market reaction was quite positive on good volume, which lead to a decent price increase during the week.Note
UPDATE (week ending 04-Jul): Newer high of $4.10 formed during the week ($0.09 above the previous high), with suggestion to raise profitable stop $0.09 higher to $3.62 ($0.67 above one tick beneath Darvas box).Note
UPDATE (week ending 11-Jul): Newer high of $4.16 formed during the week ($0.06 above the previous high), with suggestion to raise profitable stop $0.06 higher to $3.68 ($0.73 above one tick beneath Darvas box).Note
UPDATE (week ending 18-Jul): Dividend of $0.095 paid during the week on 15th July as an additional benefit. No newer high formed during this trading week, so charts are suggesting to maintain profitable stop at the current position of $3.68 at the present time for anyone wishing to remain in the trade, considering the long-term resistance of $4.00 from the open of 17th April 2023 that is now in effect with the share price closing at $3.95 between the 10 and 30 day MA's at the end of the trading week.Trade closed manually
UPDATE (week ending 25-Jul): Momentum change has certainly occurred with respect to the MTS trade, considering a number of factors: (i) -DI crossover the +DI on the DMI indicator of the daily chart, (ii) RSI crossover below 50 on the daily chart, and (iii) failure of the sideways channel formed on the daily chart since the gap-down on 15th July on 23rd July on significant volume. For those traders/investors remaining in the trade, consider taking profits since the position opening on 9th May (approximately $0.52 plus $0.095 dividend paid on 15th July = $0.615 from entry price of $3.31 = 18.9% return).Alternatively, consider observing market reaction at potential support level of $3.73 formed from the open of 16th June or utilise the profitable stop that still exists from the Darvas box technique (i.e.: $3.68) noted from last week's comment. Regardless, congratulations on a terrific trade! Coverage ceased.
Detailed commentary/updates about trades (stocks, crypto & bonds) available:
ivorywolf.start.page/ (Facebook / Telegram / YouTube / personal web-page)
Like/join/subscribe for the latest!
...
ivorywolf.start.page/ (Facebook / Telegram / YouTube / personal web-page)
Like/join/subscribe for the latest!
...
Disclaimer
The information and publications are not meant to be, and do not constitute, financial, investment, trading, or other types of advice or recommendations supplied or endorsed by TradingView. Read more in the Terms of Use.