📊 Complete Technical Analysis – 12H Timeframe (BINANCE)
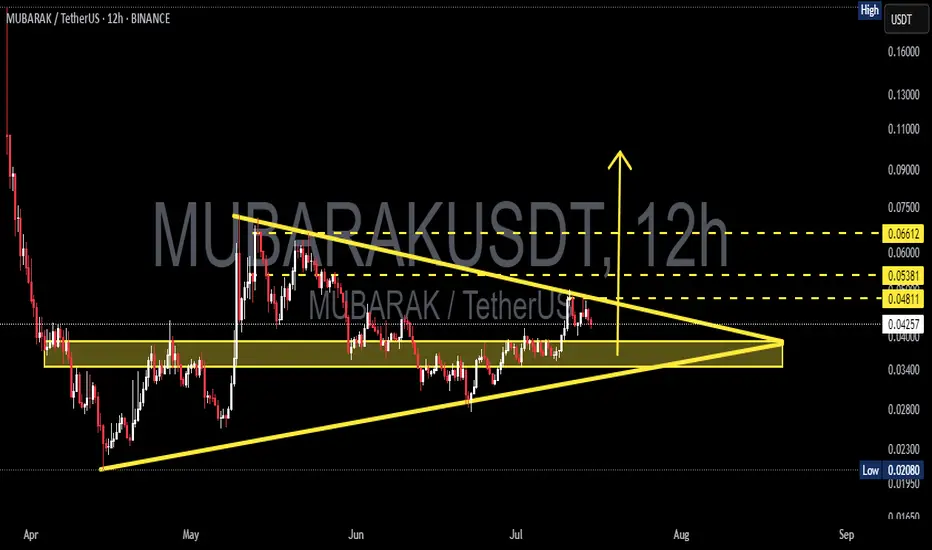
The MUBARAK/USDT pair is currently in a tight consolidation phase, forming a classic Symmetrical Triangle pattern. This structure indicates mounting pressure from both buyers and sellers, typically leading to a high-volatility breakout once the price escapes the triangle boundaries.
🔺 Pattern: Symmetrical Triangle – Sign of Impending Volatility
Rising Support Trendline (Higher Lows): Shows that buyers are gradually pushing price higher from each dip.
Descending Resistance Trendline (Lower Highs): Sellers are still active, but their strength is weakening over time.
Declining Volume: A healthy consolidation — decreasing volume is a hallmark of triangles before big moves.
Although neutral by nature, in this context, the bullish momentum seems stronger as price holds above key support.
🎯 Key Price Levels:
Price Level Description
0.04811 Breakout zone & first resistance
0.05381 Short-term target post-breakout
0.06000 Psychological resistance and reaction zone
0.06612 Maximum target based on triangle height projection
🟢 Bullish Scenario:
If price successfully breaks above the triangle’s resistance line and closes above 0.0481 USDT with strong volume:
Potential rally toward the 0.053 – 0.066 USDT range.
Triangle projection suggests a move of +50% or more from current levels.
Breakout confirmation: 12H candle close above 0.050 with above-average volume.
📌 Note: A post-breakout retest of the breakout line can offer a second entry opportunity if it holds as new support.
🔴 Bearish Scenario:
If the price breaks below the ascending support line:
Price may drop toward the demand zone between 0.034 – 0.030 USDT.
A deeper correction may target the previous low at 0.0208 USDT.
Watch for fakeouts — low-volume breakdowns may not hold.
🧠 Risk-Reward Strategy:
Aggressive Entry: On strong breakout above 0.048 with rising volume.
Conservative Entry: Wait for breakout confirmation + successful retest.
Stop Loss: Below 0.041 or just under the triangle's lower boundary.
Targets: TP1 at 0.053, TP2 at 0.060, TP3 at 0.066 (max range).
✅ Conclusion:
MUBARAK/USDT is at a critical juncture—a likely breakout from this symmetrical triangle could trigger a significant directional move. Traders should closely monitor volume spikes and candle closures for confirmation. This could be the beginning of a new trend phase for this asset.
#MUBARAKUSDT #CryptoBreakout #SymmetricalTriangle #AltcoinAnalysis #TechnicalSetup #TradingSignals #BullishSetup #BearishRisk #PriceAction
✅ Get Free Signals! Join Our Telegram Channel Here: t.me/TheCryptoNuclear
✅ Twitter: twitter.com/crypto_nuclear
✅ Join Bybit : partner.bybit.com/b/nuclearvip
✅ Benefits : Lifetime Trading Fee Discount -50%
✅ Twitter: twitter.com/crypto_nuclear
✅ Join Bybit : partner.bybit.com/b/nuclearvip
✅ Benefits : Lifetime Trading Fee Discount -50%
Disclaimer
The information and publications are not meant to be, and do not constitute, financial, investment, trading, or other types of advice or recommendations supplied or endorsed by TradingView. Read more in the Terms of Use.