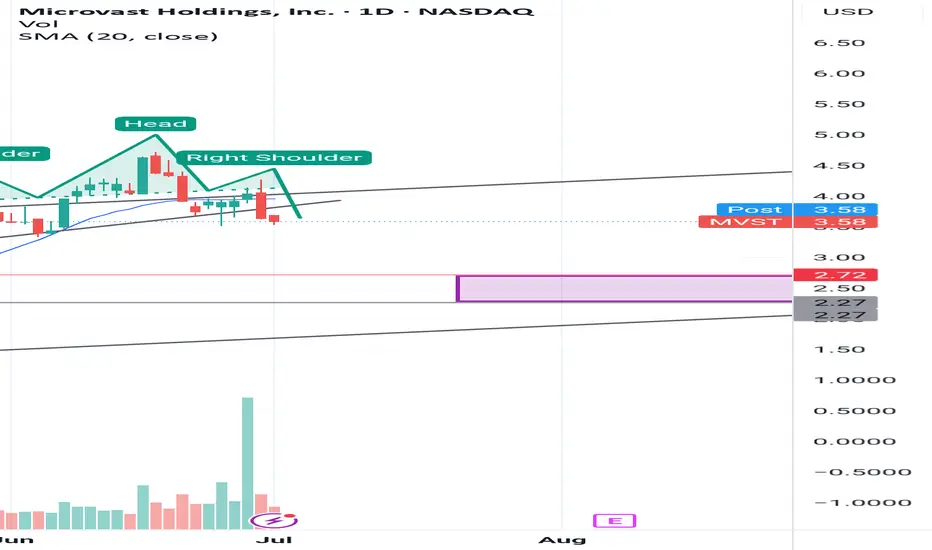
A classic Head and Shoulders pattern has formed on MVST's daily chart, with a clear neckline break to the downside. This technical setup suggests bearish momentum in the short term, with a likely price target between $2.25 and $2.75.
This zone also aligns with a prior consolidation area and dynamic support. I expect the stock to potentially find a bottom in this area. If MVST can deliver strong Q2 earnings in August, a bullish reversal from that demand zone could follow.
This zone also aligns with a prior consolidation area and dynamic support. I expect the stock to potentially find a bottom in this area. If MVST can deliver strong Q2 earnings in August, a bullish reversal from that demand zone could follow.
Disclaimer
The information and publications are not meant to be, and do not constitute, financial, investment, trading, or other types of advice or recommendations supplied or endorsed by TradingView. Read more in the Terms of Use.
Disclaimer
The information and publications are not meant to be, and do not constitute, financial, investment, trading, or other types of advice or recommendations supplied or endorsed by TradingView. Read more in the Terms of Use.