Technical Analysis of Nakamoto.Games / USDT Based on the Chart
General Trend and Support/Resistance Levels:
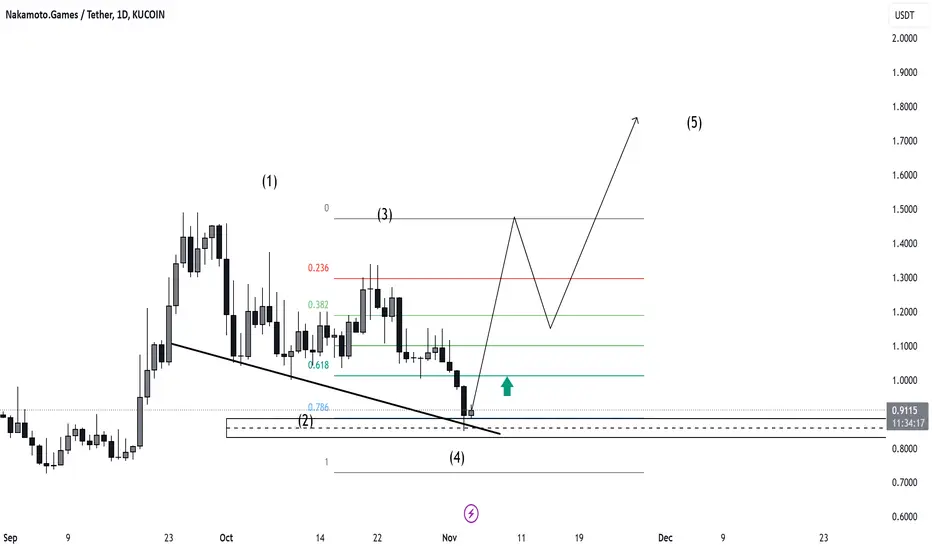
The chart shows that Nakamoto.Games has reached a strong support area near the 0.786 Fibonacci level, indicating the possible end of the current correction and the start of a new upward wave.
Main Support at the 0.786 Fibonacci level strengthens the likelihood of a rebound from this level, resuming the upward trend.
Technical Pattern:
The chart displays an Elliott Wave structure, with waves (1) to (4) completed. Expectations point towards the start of the fifth wave.
Price Expectations:
The fifth wave is anticipated to form a rally, potentially reaching new highs if bullish momentum persists.
#NakamotoGames
#Crypto
#TechnicalAnalysis
General Trend and Support/Resistance Levels:
The chart shows that Nakamoto.Games has reached a strong support area near the 0.786 Fibonacci level, indicating the possible end of the current correction and the start of a new upward wave.
Main Support at the 0.786 Fibonacci level strengthens the likelihood of a rebound from this level, resuming the upward trend.
Technical Pattern:
The chart displays an Elliott Wave structure, with waves (1) to (4) completed. Expectations point towards the start of the fifth wave.
Price Expectations:
The fifth wave is anticipated to form a rally, potentially reaching new highs if bullish momentum persists.
#NakamotoGames
#Crypto
#TechnicalAnalysis
Subscribe to my Telegram Channel 👉 :
t.me/addlist/y5mi70s3c0Y3MDQ0
Subscribe to my X 👉 : x.com/VIPROSETR
t.me/addlist/y5mi70s3c0Y3MDQ0
Subscribe to my X 👉 : x.com/VIPROSETR
Disclaimer
The information and publications are not meant to be, and do not constitute, financial, investment, trading, or other types of advice or recommendations supplied or endorsed by TradingView. Read more in the Terms of Use.