Good night traders.
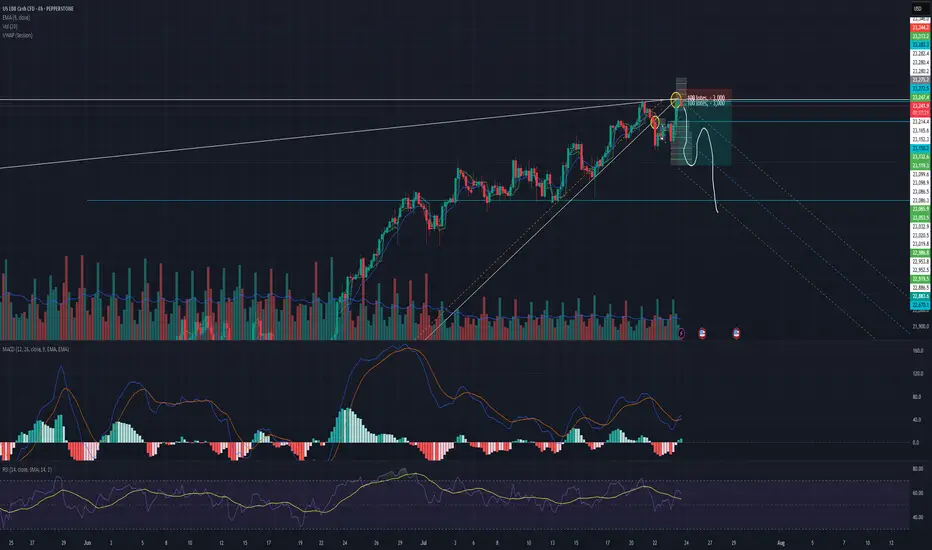
With Tuesday & today's move. NQ has broken the ascending trend, and retested the highs.
A total of 107 daily candles, 7,000pips move.
Reasons for taking this trade:
Current monthly candle has 2.9m volume, compared to a 6m & 7million from last 2 months. With only 8 days missing to end the month, how to fill all that pending volume?
Ascending trend has been broken and retested.
Expect a deep correction, around 2000-2400-2600 pips. There is correlation between 38.2 Fibo level.
Last week there was a manipulation with Powell dismiss rumor on Wednesday, next day on Thursday NQ rallied to the upside. Today being also Wednesday we saw a huge rejection to the upside, but there is no continuation.
DXY reaching bottom, + has a deeper short trend initiation, starting on January 13.
Trade will be validated if NQ creates a LL followed by a LH within the next 2 days.
What do you think of this analysis?
Thank you.
Enjoy
Trade active
Today's last 4 candles of H2, or the last H8 candlestick has more selling volume than buys. Are we all really that stupid to sell on a direction day? Who is adding all those sell positions? Market makers closing last week sells to push the price up while adding sells to control price at the highest peak? I dont know, something smells so fishy.Trade closed: target reached
Pushing SL to BE or 23271, just at the start of H1 candlestick. If price breaks 23300 it would be pretty obvious that will paint some grounding pushing more, thats why we minimize risk. US30 broke & touched 45049 price but got rejected directly below 45950. I believe this double/triple daily top formation is the reason and the start of a deep correction. Last time it touched 45000 was 169days ago, it must have a deep retracement.
Channel size may depend on next LL and LH.
Watch for 23060 followed by 22900-22850
Note
Hello traders. I'm bringing you current update from NQ.Currently US30 is forming a fall from H2 trying to reach a new support (LL).
NQ has formed a triple top pattern, indicating fatigue from buyers, My downside channel has been invalidated, however now we must be patient until NQ reaches the neckline of the triple top.
Breaking the neckline will confirm NQ looking for a new LL. After this if a LH is made and rejected we can confirm a change of trend.
Note
The second valley between 2nd top and 3rd top is pretty small, however Institution selling orders starts from price 23030 up to 23280.Today's last 4 candles of H2 have more buying volume than sellers. This could indicate impatience from buyers, & a possible bullish trap due to the valley size. Even if lagging indicators such as MACD or RSI have space to push to the upside it can be rejected pretty quickly due to lack of volume. Note that daily candlestick also has less volume.
Disclaimer
The information and publications are not meant to be, and do not constitute, financial, investment, trading, or other types of advice or recommendations supplied or endorsed by TradingView. Read more in the Terms of Use.
Disclaimer
The information and publications are not meant to be, and do not constitute, financial, investment, trading, or other types of advice or recommendations supplied or endorsed by TradingView. Read more in the Terms of Use.