Curious about tricking your trading mind?
A lot of traders are constantly searching for new indicators or secret setups. But what if your biggest breakthrough is just a perspective shift away—literally?
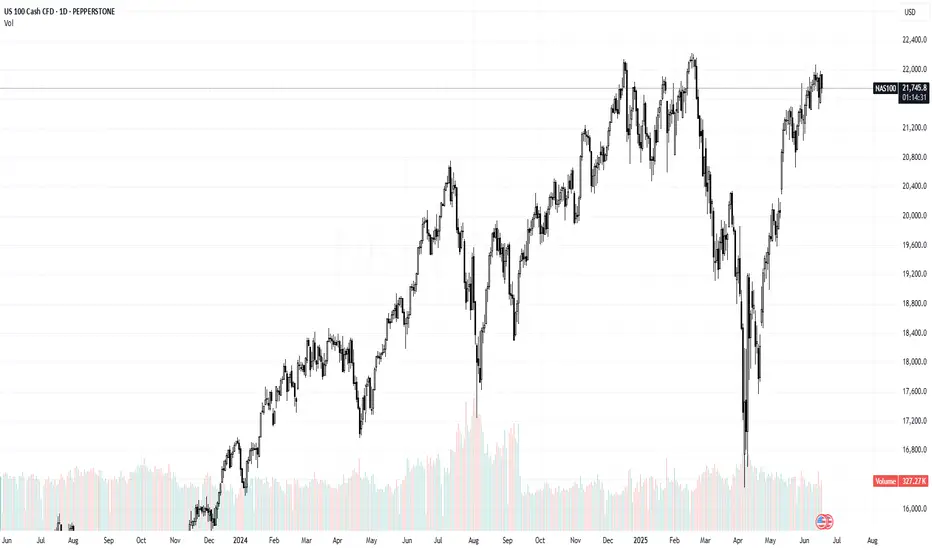
This article is about a unique but effective experiment: Rotate your candlestick chart by 90 degrees (horizontal instead of vertical) and see how your perception and analysis change.
Example: ibb.co/CKxy2MLH
No, this isn’t a volume profile – this is the real NAS100 chart, just rotated by 90°!
What do you see now? New patterns? Different price action? Sometimes a fresh angle reveals details you normally overlook and helps break your trading habits.
---
What changes?
1. Patterns suddenly look different
Trends, consolidations, and breakouts appear in a new light:
– Uptrends and downtrends lose their emotional “up feels hard, down feels easy” effect.
– Sideways markets become vertical clusters—your eye spots new structures.
2. Support & resistance become less dominant
Your classic support and resistance zones disappear.
You’re forced to rethink important levels—maybe you’ll notice supply/demand zones you always missed.
3. Emotional neutrality
With a rotated chart, the usually existing “Long is better” bias fades.
You view price action more objectively—and may discover signals you’d otherwise miss.
---
Try it out!
What did you discover by rotating your chart? Comment below or share your thoughts!
A lot of traders are constantly searching for new indicators or secret setups. But what if your biggest breakthrough is just a perspective shift away—literally?
This article is about a unique but effective experiment: Rotate your candlestick chart by 90 degrees (horizontal instead of vertical) and see how your perception and analysis change.
Example: ibb.co/CKxy2MLH
No, this isn’t a volume profile – this is the real NAS100 chart, just rotated by 90°!
What do you see now? New patterns? Different price action? Sometimes a fresh angle reveals details you normally overlook and helps break your trading habits.
---
What changes?
1. Patterns suddenly look different
Trends, consolidations, and breakouts appear in a new light:
– Uptrends and downtrends lose their emotional “up feels hard, down feels easy” effect.
– Sideways markets become vertical clusters—your eye spots new structures.
2. Support & resistance become less dominant
Your classic support and resistance zones disappear.
You’re forced to rethink important levels—maybe you’ll notice supply/demand zones you always missed.
3. Emotional neutrality
With a rotated chart, the usually existing “Long is better” bias fades.
You view price action more objectively—and may discover signals you’d otherwise miss.
---
Try it out!
What did you discover by rotating your chart? Comment below or share your thoughts!
Disclaimer
The information and publications are not meant to be, and do not constitute, financial, investment, trading, or other types of advice or recommendations supplied or endorsed by TradingView. Read more in the Terms of Use.
Disclaimer
The information and publications are not meant to be, and do not constitute, financial, investment, trading, or other types of advice or recommendations supplied or endorsed by TradingView. Read more in the Terms of Use.