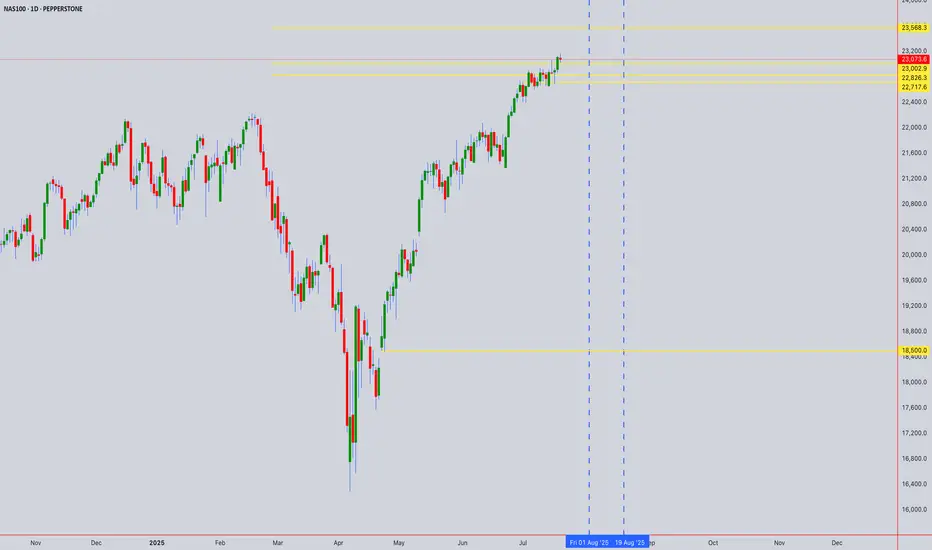
Current Price: 23,076.60 (Close: Friday, July 18th, 2025)
Analysis Period: Next 24 Hours (July 19-20, 2025)
Market Status: Weekend - Preparing for Monday Open
---------------------------------------------------------------------------------------------
EXECUTIVE SUMMARY - 24H OUTLOOK
Primary Bias: Neutral to Bullish (Short-term consolidation expected)
Key Resistance: 23,150 - 23,250
Critical Support: 22,850 - 22,950
Expected Range: 22,900 - 23,200
Volatility Level: Moderate (Tech earnings season approach)
---------------------------------------------------------------------------------------------
1. CANDLESTICK PATTERN ANALYSIS
Friday's Close Formation
---------------------------------------------------------------------------------------------
Pattern: Small-bodied candle with upper shadow at 23,076
Significance: Indecision after testing resistance near 23,150
Volume: Above-average volume suggesting institutional activity
Context: Failed to break cleanly above psychological 23,100 level
---------------------------------------------------------------------------------------------
Expected 24H Patterns
---------------------------------------------------------------------------------------------
Monday Gap: Potential small gap up to 23,100-23,120 area
Continuation Pattern: Bullish flag/pennant formation developing
Key Reversal: Watch for hammer formation at 22,950 support if decline occurs
---------------------------------------------------------------------------------------------
Pattern Probability Assessment
---------------------------------------------------------------------------------------------
Doji/Spinning Top: 40% probability (continued indecision)
Bullish Engulfing: 35% probability (if gap up occurs)
Bearish Reversal: 25% probability (if resistance holds)
---------------------------------------------------------------------------------------------
2. HARMONIC PATTERN ANALYSIS
Current Harmonic Setup
---------------------------------------------------------------------------------------------
Primary Pattern: Bullish Cypher Pattern in Development
---------------------------------------------------------------------------------------------
X: 22,400 (previous major low)
A: 23,250 (recent swing high)
B: 22,800 (61.8% retracement)
C: 23,150 (127.2% extension - current test area)
D (Completion): 22,650-22,750 (78.6% retracement zone)
---------------------------------------------------------------------------------------------
Alternative Pattern: Bull Flag
---------------------------------------------------------------------------------------------
Pole: 22,400 → 23,250 (850-point move)
Flag: Current consolidation 22,950-23,150
Target: 23,250 + 850 = 24,100 (extended projection)
---------------------------------------------------------------------------------------------
Fibonacci Levels (24H Focus)
---------------------------------------------------------------------------------------------
Golden Ratio Support: 22,950 (61.8% of recent swing)
38.2% Retracement: 23,025
23.6% Retracement: 23,050
Extension Target: 23,375 (161.8% projection)
---------------------------------------------------------------------------------------------
3. ELLIOTT WAVE THEORY - 24H COUNT
Primary Wave Count (Bullish Scenario)
---------------------------------------------------------------------------------------------
Macro Structure: Wave 5 of larger degree impulse in progress
Current Position: Wave 4 correction completing
Mini-wave Count: Flat correction pattern (A-B-C structure)
---------------------------------------------------------------------------------------------
24-Hour Wave Projection
---------------------------------------------------------------------------------------------
Wave A: 23,250 → 22,800 (Completed)
Wave B: 22,800 → 23,150 (Completed - 70% retrace)
Wave C: 23,150 → 22,950 (In Progress - Equal to A)
Wave 5 Target: 24,000-24,200 (1.618 extension)
---------------------------------------------------------------------------------------------
Alternative Count (Corrective Scenario)
---------------------------------------------------------------------------------------------
Structure: Double zigzag correction
Current Phase: Second zigzag development
Target: 22,750-22,850 (Wave Y completion)
---------------------------------------------------------------------------------------------
Critical Elliott Levels
---------------------------------------------------------------------------------------------
Wave 4 Low: 22,750 (must hold for bullish count)
Invalidation: Below 22,400 (Wave 1 high)
Confirmation: Break above 23,250 (Wave 3 high)
---------------------------------------------------------------------------------------------
4. WYCKOFF THEORY - 24H PHASE
Current Market Phase Assessment
---------------------------------------------------------------------------------------------
Primary Phase: Reaccumulation (Phase B-C transition)
Composite Operator Action: Testing supply at 23,150 area
Volume Analysis: Absorption of selling pressure evident
Smart Money Activity: Institutional buying on dips below 23,000
---------------------------------------------------------------------------------------------
Expected 24H Wyckoff Dynamics
---------------------------------------------------------------------------------------------
Phase Progression: Moving toward Phase D (Sign of Strength)
Testing Action: Final test of support at 22,950-23,000
Volume Expectation: Declining volume on any weakness
Breakout Setup: Spring action possible below 22,950
---------------------------------------------------------------------------------------------
Key Wyckoff Signals (24H Watch List)
---------------------------------------------------------------------------------------------
Sign of Strength (SOS): Break above 23,150 with volume
Last Point of Support (LPS): 22,950 area test
No Supply: Expected on rallies to 23,100-23,150
Backup to Edge of Creek: Potential dip to 22,850
---------------------------------------------------------------------------------------------
5. W.D. GANN THEORY - 24H ANALYSIS
Square of Nine Analysis
---------------------------------------------------------------------------------------------
Current Position: 23,076° on Gann wheel
Next Cardinal Point: 23,100° (significant psychological resistance)
Natural Support: 23,000° (perfect square - strong magnetic level)
Critical Angle: 22,900° (45-degree angle support from recent low)
---------------------------------------------------------------------------------------------
Time Theory - 24H Cycle
---------------------------------------------------------------------------------------------
Natural Time Cycle: 24-hour cycle from Friday's close
Critical Time Windows:
---------------------------------------------------------------------------------------------
6 hours: 02:00 UTC Monday (potential turn time)
18 hours: 14:00 UTC Monday (major turn potential)
24 hours: 20:00 UTC Monday (cycle completion)
---------------------------------------------------------------------------------------------
Angle Theory Application
---------------------------------------------------------------------------------------------
Rising 45° Line: Currently at 22,950 (critical support)
Rising 63.75° Line: 23,100 (steep resistance angle)
Declining 26.25° Line: 23,150 (gentle resistance)
---------------------------------------------------------------------------------------------
Gann Price Forecasting
---------------------------------------------------------------------------------------------
Square Root Method:
---------------------------------------------------------------------------------------------
Current: √23,076 ≈ 151.9
Next resistance: 152² = 23,104
Major resistance: 153² = 23,409
---------------------------------------------------------------------------------------------
Primary Target: 23,104 (natural Gann resistance)
Extended Target: 23,409 (next perfect square)
---------------------------------------------------------------------------------------------
Time-Price Harmony
---------------------------------------------------------------------------------------------
Harmonic Time: 144 hours from last major low
Price Harmony: 23,076 in harmony with 22,500 base
Next Harmony Level: 23,400 (Fibonacci price relationship)
---------------------------------------------------------------------------------------------
6. MULTI-TIMEFRAME INTRADAY ANALYSIS
5-Minute Chart Analysis
---------------------------------------------------------------------------------------------
Micro Trend: Consolidating triangle pattern
Support: 23,050-23,060 (recent lows)
Resistance: 23,090-23,100 (intraday highs)
Volume Profile: Balanced - no clear direction
RSI (5M): 48-52 range (neutral)
Pattern: Symmetrical triangle (breakout pending)
---------------------------------------------------------------------------------------------
15-Minute Chart Analysis
---------------------------------------------------------------------------------------------
Structure: Bull flag formation
Flag Boundaries: 23,040-23,120
Breakout Level: Above 23,120 (bullish)
Breakdown Level: Below 23,040 (bearish)
Moving Averages: EMA20 at 23,065 (support)
MACD: Consolidating above zero line
---------------------------------------------------------------------------------------------
30-Minute Chart Analysis
---------------------------------------------------------------------------------------------
Primary Pattern: Ascending triangle
Horizontal Resistance: 23,150 (multiple tests)
Rising Support Line: From 22,950 to current levels
Breakout Target: 23,350 (triangle height projection)
Volume: Decreasing (typical triangle behavior)
Bollinger Bands: Contracting (low volatility)
---------------------------------------------------------------------------------------------
1-Hour Chart Analysis
---------------------------------------------------------------------------------------------
Major Structure: Bullish continuation pattern
Cup and Handle: Handle formation in progress
Handle Depth: 7% correction (healthy)
Breakout Level: 23,175 (handle resistance)
Target: 24,000 (cup depth projection)
RSI (1H): 55 (bullish but not overbought)
---------------------------------------------------------------------------------------------
4-Hour Chart Analysis
---------------------------------------------------------------------------------------------
Macro Trend: Strong uptrend intact
Correction Type: Shallow pullback (wave 4 character)
Support Cluster: 22,900-23,000 (multiple confluences)
Resistance Zone: 23,150-23,250
Ichimoku Cloud: Price above cloud (bullish)
Volume Trend: Higher lows pattern (accumulation)
---------------------------------------------------------------------------------------------
7. TECHNICAL INDICATORS MATRIX
Momentum Indicators
---------------------------------------------------------------------------------------------
RSI (4H): 58 (Bullish momentum, room for upside)
RSI (1H): 55 (Neutral-bullish)
Stochastic %K: 62 (Above %D line - bullish)
Williams %R: -35 (Not oversold, upside potential)
---------------------------------------------------------------------------------------------
Trend Indicators
---------------------------------------------------------------------------------------------
MACD (4H): Above signal line, histogram positive
ADX: 35 (Strong trend strength)
Parabolic SAR: 22,950 (supportive)
Supertrend: 22,850 (strong support)
---------------------------------------------------------------------------------------------
Volume Indicators
---------------------------------------------------------------------------------------------
OBV: Rising trend (accumulation pattern)
Volume Rate of Change: Positive
Chaikin Money Flow: +0.15 (buying pressure)
Accumulation/Distribution: Uptrend
---------------------------------------------------------------------------------------------
8. KEY SUPPORT & RESISTANCE LEVELS (24H)
Critical Resistance Levels
---------------------------------------------------------------------------------------------
R1: 23,100 (Psychological + Gann)
R2: 23,150 (Technical resistance + harmonic)
R3: 23,200 (Minor resistance)
R4: 23,250 (Major swing high)
R5: 23,350 (Extended target)
---------------------------------------------------------------------------------------------
Vital Support Levels
---------------------------------------------------------------------------------------------
S1: 23,040 (Immediate support)
S2: 23,000 (Psychological + Gann)
S3: 22,950 (Critical support cluster)
S4: 22,900 (Strong technical support)
S5: 22,850 (Major support zone)
---------------------------------------------------------------------------------------------
9. 24-HOUR TRADING SCENARIOS
Scenario 1: Bullish Breakout (50% Probability)
---------------------------------------------------------------------------------------------
Trigger: Break above 23,120 with volume expansion
Initial Target: 23,180-23,200
Extended Target: 23,300-23,350
Stop Loss (Longs): Below 22,990
Expected Timeline: 12-18 hours from breakout
---------------------------------------------------------------------------------------------
Scenario 2: Continued Consolidation (35% Probability)
---------------------------------------------------------------------------------------------
Range: 23,000-23,150
Trading Strategy: Range-bound scalping
Buy Zone: 23,020-23,040
Sell Zone: 23,120-23,140
Duration: Full 24-hour period
---------------------------------------------------------------------------------------------
Scenario 3: Bearish Breakdown (15% Probability)
---------------------------------------------------------------------------------------------
Trigger: Break below 22,990 on volume
Target 1: 22,900-22,950
Target 2: 22,850-22,900
Bounce Level: 22,800-22,850
Recovery Above: 23,050 negates bearish scenario
---------------------------------------------------------------------------------------------
10. RISK FACTORS & CATALYSTS (24H)
Bullish Catalysts
---------------------------------------------------------------------------------------------
Tech earnings optimism building
AI sector momentum continuation
Institutional portfolio rebalancing (month-end flows)
Strong economic data expectations
Risk-on sentiment from Asia markets
---------------------------------------------------------------------------------------------
Bearish Risk Factors
---------------------------------------------------------------------------------------------
Profit-taking ahead of earnings
Rising bond yields concern
Geopolitical tensions impact
Overbought technical condition worries
Sector rotation out of tech
---------------------------------------------------------------------------------------------
High-Impact Events (Next 24H)
---------------------------------------------------------------------------------------------
Asian market opening (risk sentiment gauge)
Weekend news flow analysis
Pre-earnings positioning
Options expiry effects
Futures gap analysis
---------------------------------------------------------------------------------------------
11. TRADING RECOMMENDATIONS (24H)
For Scalpers (5M-15M Timeframes)
---------------------------------------------------------------------------------------------
Primary Setup: Triangle breakout trade
Entry Long: Above 23,120
Target: 23,160-23,180
Stop Loss: 23,080
Risk/Reward: 1:2 ratio
---------------------------------------------------------------------------------------------
For Intraday Traders (30M-1H)
---------------------------------------------------------------------------------------------
Strategy: Bull flag continuation
Entry Zone: 23,050-23,070 (on dips)
Target 1: 23,150
Target 2: 23,200
Stop Loss: 23,000
---------------------------------------------------------------------------------------------
For Swing Setup (4H basis)
---------------------------------------------------------------------------------------------
Approach: Pullback buying opportunity
Optimal Entry: 22,950-23,000
Primary Target: 23,350-23,400
Extended Target: 23,600
Stop Loss: 22,850
---------------------------------------------------------------------------------------------
12. CONFLUENCE ANALYSIS
Bullish Confluence at 22,950-23,000
---------------------------------------------------------------------------------------------
Gann Theory: 23,000° perfect square support
Elliott Wave: Wave 4 completion zone
Wyckoff: Last Point of Support (LPS)
Fibonacci: 61.8% retracement level
Moving Averages: EMA 50 confluence
Volume Profile: High volume node support
---------------------------------------------------------------------------------------------
Resistance Confluence at 23,150-23,200
---------------------------------------------------------------------------------------------
Harmonic: Cypher pattern C-point resistance
Previous Structure: Multiple test area
Psychological: Round number resistance
Gann Angles: 63.75° resistance line
Elliott Wave: Wave B completion area
Technical: Flag pattern upper boundary
---------------------------------------------------------------------------------------------
FINAL 24H FORECAST SUMMARY
Most Likely Scenario: Continued consolidation with upward bias, testing 23,150 resistance with potential breakout to 23,200+ levels.
Trading Range Expectation: 22,980 - 23,180 (primary range)
Breakout Levels:
---------------------------------------------------------------------------------------------
Bullish: Above 23,120 → targets 23,200-23,350
Bearish: Below 22,980 → targets 22,900-22,950
---------------------------------------------------------------------------------------------
Key Time Windows:
---------------------------------------------------------------------------------------------
Asian Open: 00:00-02:00 UTC (gap direction)
US Pre-market: 08:00-13:30 UTC (institutional flows)
US Cash Open: 13:30 UTC (volume confirmation)
---------------------------------------------------------------------------------------------
Risk Management Notes:
---------------------------------------------------------------------------------------------
Position sizing should account for tech sector volatility
Weekend gap risk considerations
Earnings season positioning effects
---------------------------------------------------------------------------------------------
Probability Assessment:
---------------------------------------------------------------------------------------------
50% - Bullish breakout scenario
35% - Range-bound consolidation
15% - Bearish breakdown
---------------------------------------------------------------------------------------------
Disclaimer: This analysis is for educational purposes only. Trading involves substantial risk of loss. Always use appropriate risk management and never risk more than you can afford to lose. Past performance does not guarantee future results.
---------------------------------------------------------------------------------------------
---------------------------------------------------------------------------------------------
For those interested in further developing their trading skills based on these types of analyses, consider exploring the mentoring program offered by Shunya Trade.
I welcome your feedback on this analysis, as it will inform and enhance my future work.
Regards,
Shunya Trade
⚠️ Disclaimer: This post is educational content and does not constitute investment advice, financial advice, or trading recommendations. The views expressed here are based on technical analysis and are shared solely for informational purposes. The stock market is subject to risks, including capital loss, and readers should exercise due diligence before investing. We do not take responsibility for decisions made based on this content. Consult a certified financial advisor for personalized guidance.
Disclaimer
The information and publications are not meant to be, and do not constitute, financial, investment, trading, or other types of advice or recommendations supplied or endorsed by TradingView. Read more in the Terms of Use.
Disclaimer
The information and publications are not meant to be, and do not constitute, financial, investment, trading, or other types of advice or recommendations supplied or endorsed by TradingView. Read more in the Terms of Use.