Hi there,
NAS100 has been very surprising for us recently, with increased bullishness that appears to be giving a bearish bias.
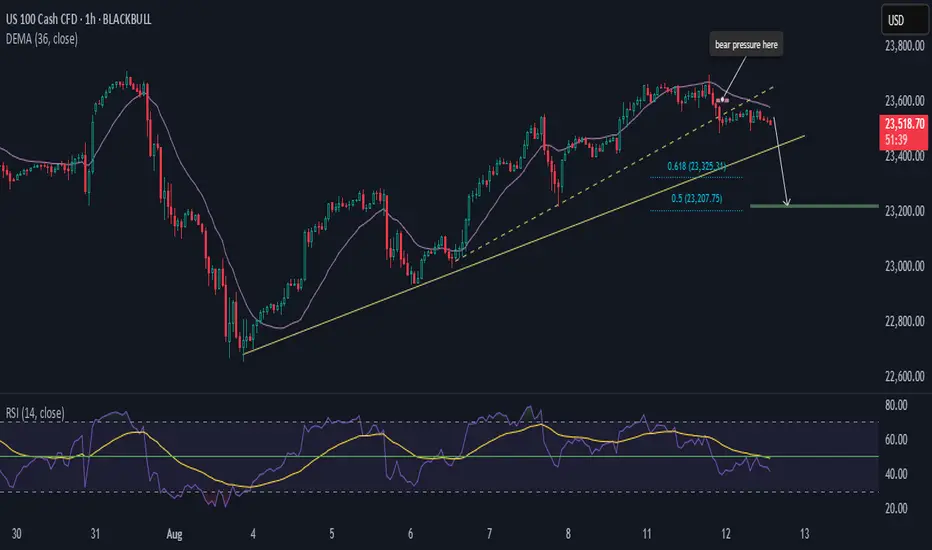
🦉 We'll use RSI and DEMA to coordinate price movements.
🎙️The price is bearish from the 23,600 area and has broken a minor dashed trendline. As long as the price remains below the purple 36 DEMA, below the RSI 50 level, and below the yellow RSI EMA, we remain bearish toward the solid trendline. This outlook points to two target support areas: 23,325 and 23,207.
🧩 Note: the bearish momentum is driven by the 3-hour chart. If it changes there, the setup will be invalidated.
Happy Trading,
K.
NAS100 has been very surprising for us recently, with increased bullishness that appears to be giving a bearish bias.
🦉 We'll use RSI and DEMA to coordinate price movements.
🎙️The price is bearish from the 23,600 area and has broken a minor dashed trendline. As long as the price remains below the purple 36 DEMA, below the RSI 50 level, and below the yellow RSI EMA, we remain bearish toward the solid trendline. This outlook points to two target support areas: 23,325 and 23,207.
🧩 Note: the bearish momentum is driven by the 3-hour chart. If it changes there, the setup will be invalidated.
Happy Trading,
K.
Order cancelled
Invalidated. So it does this. We'll spend some time on NAS100. Yeah, it's revenge trading... :)Disclaimer
The information and publications are not meant to be, and do not constitute, financial, investment, trading, or other types of advice or recommendations supplied or endorsed by TradingView. Read more in the Terms of Use.
Disclaimer
The information and publications are not meant to be, and do not constitute, financial, investment, trading, or other types of advice or recommendations supplied or endorsed by TradingView. Read more in the Terms of Use.