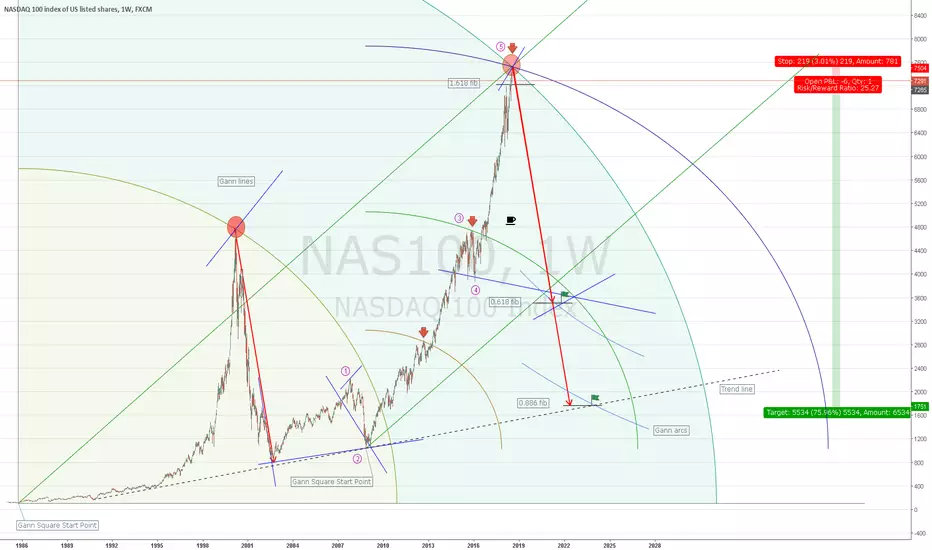
Nasdaq has gone so much up lately and I think it will turn downwards next three years.
Target 1: 3500 (52%)
Target 2: 1760 (76%)
When: April 2021 and May 2022 / January 2024
Stop loss: Above the resistance arcs.
Arguments:
- 2 different Gann Squares says it made All time high last week.
- Gann line from the Gann Square is saying the same.
- Gann Fan line also says the same.
- Elliott Wave Theory fits in.
Forecast:
- It will descend rapidly next two-three years.
- Target 1 is chosen because of all the different lines and harmonics: Gann lines from different start points, 0.618 Fibonacci level and Gann Arc is located here. The potential from the drop in 2000 is also copied in here.
- Target 2 is chosen because of the trend line marked. Here is also a 0.886 Fibonacci level and a different Gann Arc located.
- In year 2000 it dropped for almost 3 years continuously. With that in my mind I know what the potential is in this case. Same thing happen on my idea on EOSUSD (Yes, it is a different case no doubt). In other word I think both targets are likely to happen.
Note
Here is a close-up on the current situation: Note
Here is my earlier idea on EOSUSD as I mentioned: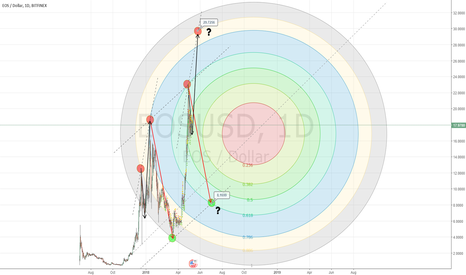
Note
Things might go faster than expected:Note
Pullback! Above the bottom line.Note
Testing the bottom line again..Note
Some weeks later this is the situation:Note
10-year:Note
10%Note
15%Note
Too much up lately? Note
Update:Note
Update:Note
It won't stop rising! This is the last arc: Note
Not sure how this will continue regarding the GANN idea, but it is clearly moving downwards currently. Right now it is testing the 50 MA.Note
Currently testing the 200 MA. The 50 MA is pointing downwards. It is also testing the support area I made earlier (red box). Look closely on the Fib levels and the Gann lines. I've sketched some possible directions ahead. Note
VIX at the moment:Note
Look like an older pivot point made it pull back. A quick rise, but will it continue?Related publications
Disclaimer
The information and publications are not meant to be, and do not constitute, financial, investment, trading, or other types of advice or recommendations supplied or endorsed by TradingView. Read more in the Terms of Use.
Related publications
Disclaimer
The information and publications are not meant to be, and do not constitute, financial, investment, trading, or other types of advice or recommendations supplied or endorsed by TradingView. Read more in the Terms of Use.