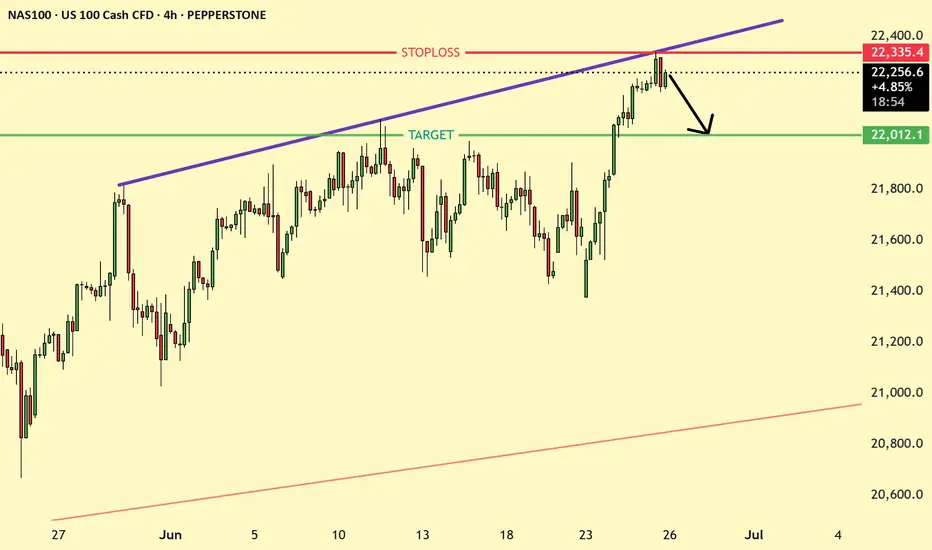
The NAS100 (4H chart) shows a rejection near the upward sloping trendline resistance and the marked stop-loss zone around 22,335.4. After a strong bullish rally, price failed to break above the resistance and is now showing signs of a pullback. A correction toward the previous breakout zone and target level of 22,012.1 is anticipated. This move aligns with typical price behavior following a resistance rejection, offering a potential short opportunity with tight risk control.
Disclaimer
The information and publications are not meant to be, and do not constitute, financial, investment, trading, or other types of advice or recommendations supplied or endorsed by TradingView. Read more in the Terms of Use.
Disclaimer
The information and publications are not meant to be, and do not constitute, financial, investment, trading, or other types of advice or recommendations supplied or endorsed by TradingView. Read more in the Terms of Use.