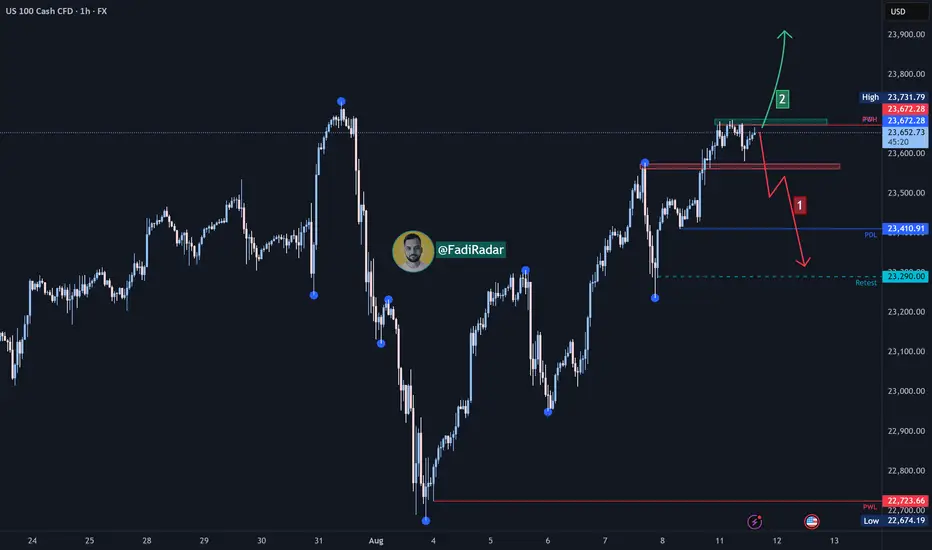
The index is currently trading near $23,670, a pivotal zone between two possible scenarios:
🔻 Bearish Scenario:
If the support at $23,570 is broken and the price holds below it, we may see a decline first toward $23,400, followed by an extended move toward $23,290 as a test area. A break below this level could open the door for further downside corrections.
🔺 Bullish Scenario:
If the price successfully breaks and holds above $23,680, this could support a continuation of the uptrend toward $23,800, and with sustained momentum, a new high could be targeted.
⚠️ Disclaimer:
This analysis is not financial advice. Please monitor market behavior and analyze data carefully before making any investment decisions.
Disclaimer
The information and publications are not meant to be, and do not constitute, financial, investment, trading, or other types of advice or recommendations supplied or endorsed by TradingView. Read more in the Terms of Use.
Disclaimer
The information and publications are not meant to be, and do not constitute, financial, investment, trading, or other types of advice or recommendations supplied or endorsed by TradingView. Read more in the Terms of Use.