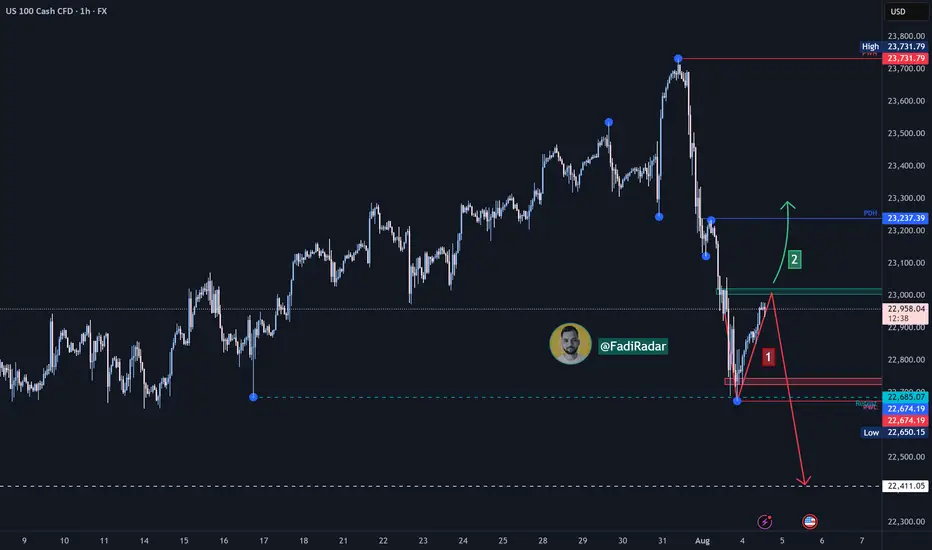
The Nasdaq index experienced a sharp drop last week, as expected, testing the 22,680$ level. Today, it's showing signs of a corrective move, currently trading around 22,950$.
🔹 Bearish Scenario:
If the price drops back to 22,680$ and breaks below it with confirmation, the next support could be 22,400$.
🔹 Bullish Scenario:
If buying momentum pushes the price above 23,000$, and it holds, we may see an extension toward 23,240$ and possibly 23,500$.
⚠️ Disclaimer:
This analysis is not financial advice. It is recommended to monitor the markets and carefully analyze the data before making any investment decisions.
Disclaimer
The information and publications are not meant to be, and do not constitute, financial, investment, trading, or other types of advice or recommendations supplied or endorsed by TradingView. Read more in the Terms of Use.
Disclaimer
The information and publications are not meant to be, and do not constitute, financial, investment, trading, or other types of advice or recommendations supplied or endorsed by TradingView. Read more in the Terms of Use.