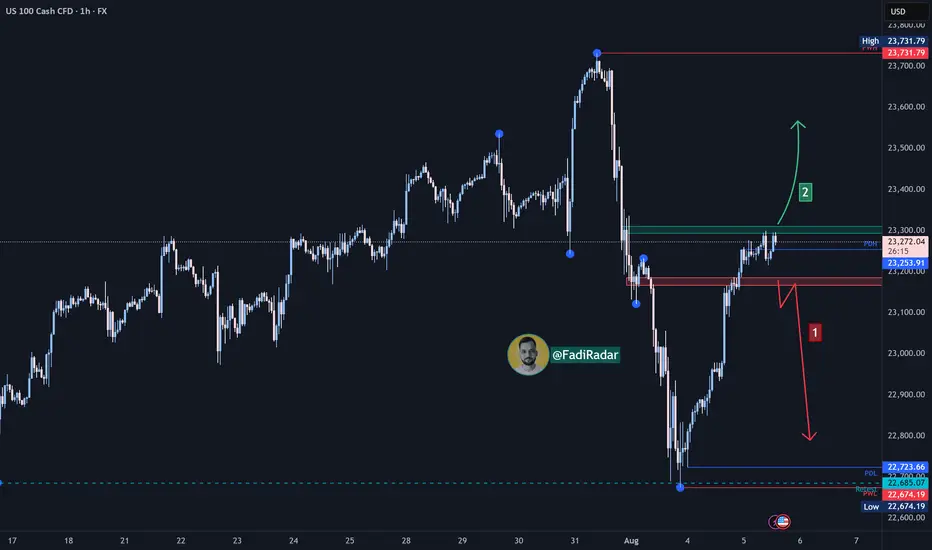
The Nasdaq Index showed improvement at the market open today and is currently trading near the $23,300 level, with price action building at a key resistance zone.
🔹 Bearish Scenario:
If the price retraces to $23,170 and breaks below it, a move toward $22,970 could follow as the next support target.
🔹 Bullish Scenario:
If the price breaks above $23,300 and holds, bullish momentum could drive the index toward $23,600.
⚠️ Disclaimer:
This analysis is not financial advice. It is recommended to monitor the markets and carefully analyze the data before making any investment decisions.
Disclaimer
The information and publications are not meant to be, and do not constitute, financial, investment, trading, or other types of advice or recommendations supplied or endorsed by TradingView. Read more in the Terms of Use.
Disclaimer
The information and publications are not meant to be, and do not constitute, financial, investment, trading, or other types of advice or recommendations supplied or endorsed by TradingView. Read more in the Terms of Use.