Hi there,
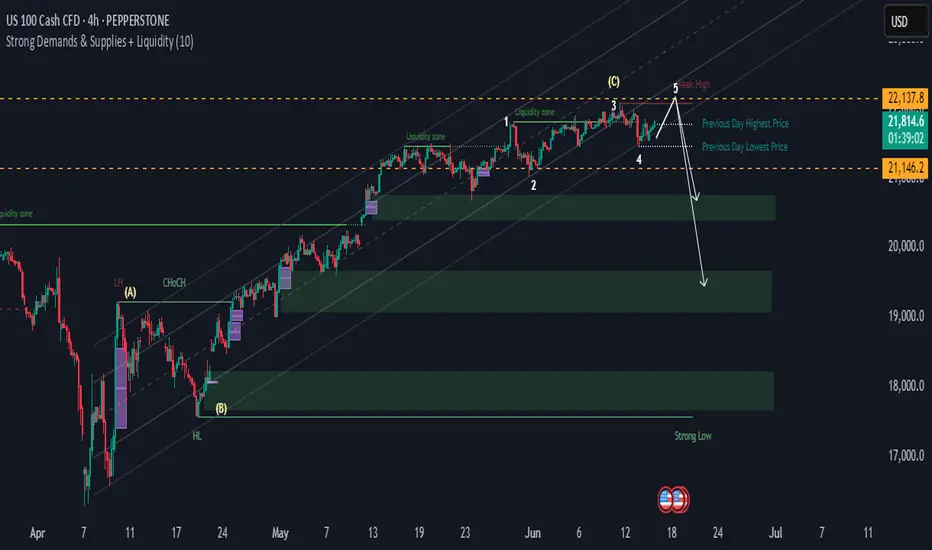
The NAS100 is slightly bullish and fairly stagnant. It is consolidating between two key levels (orange lines). A break below the price might fall into deeper demand zones.
Short Notes
- **Elliott Wave**: 5-wave structure appears complete at resistance (22,137.8), signalling a possible reversal.
- **Liquidity Zones**: Price is at/near a major liquidity zone, increasing reversal risk.
- **Break High**: There's a potential for a false breakout above wave 5 before dropping.
- **Support Levels**: The 21,800.6 (previous day high) and 21,146.2 (previous day low) for first support.
- **Demand Zones**: Strong demand below 21,146.2, with deeper support near 20,000 and 18,800.
- **Overview: A possible bearish move ahead from current highs, targeting lower demand zones.
Happy Trading,
K.
Not trading advice
Disclaimer
The information and publications are not meant to be, and do not constitute, financial, investment, trading, or other types of advice or recommendations supplied or endorsed by TradingView. Read more in the Terms of Use.
Disclaimer
The information and publications are not meant to be, and do not constitute, financial, investment, trading, or other types of advice or recommendations supplied or endorsed by TradingView. Read more in the Terms of Use.