Hi Guys,
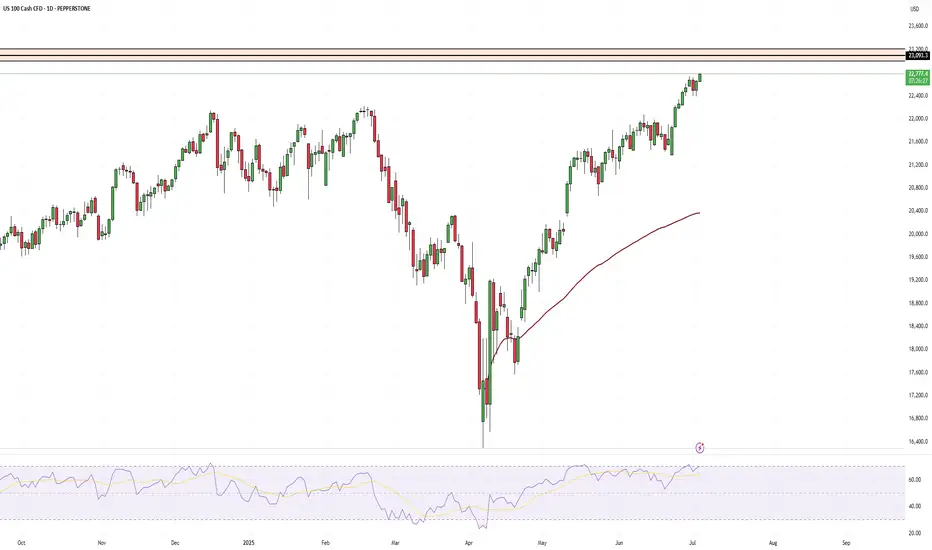
The US indices have been ripping back to all time highs without any meaningful pullbacks from the lows.
The Nasdaq is approaching a price level where we may see a pullback and some selling pressure.
The shaded box above the chart is that area and it contains two important fib levels. The bottom of the box is the 1.13 retracement of the recent high to the low after the tarrif news. The black line drawn through the box is the 2.0 retracement of the bear market high to low. This level is always important but it is more significant in this case because the SP 500 and Dow Jones both had the big drops from pretty much exactly this level. The Nasdaq failed to reach this level so if the other two indices are anything to go by we may see some selling here.
Daily RSI is showing divergence. Sell setups using break of structure chart pattern and candlestick patterns on lower time frame could result in nice risk to reward trades.
The red line coming from the bottom is the AVWAP and its no coincidence that it is in line with a n obvious support area should we get a deep enough pullback.
Safe Trading all
Disclaimer
The information and publications are not meant to be, and do not constitute, financial, investment, trading, or other types of advice or recommendations supplied or endorsed by TradingView. Read more in the Terms of Use.
Disclaimer
The information and publications are not meant to be, and do not constitute, financial, investment, trading, or other types of advice or recommendations supplied or endorsed by TradingView. Read more in the Terms of Use.