Long
NAS100 Reversal
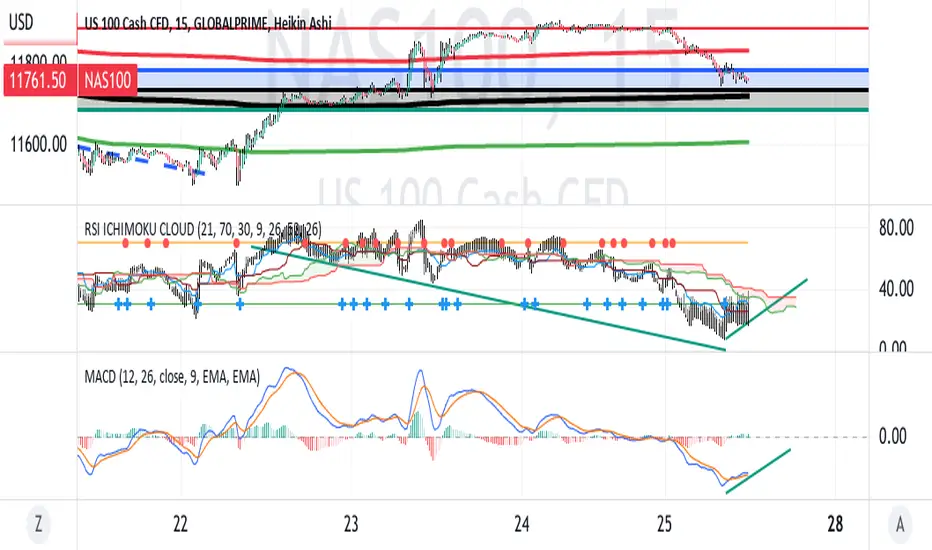
NAS has been falling in the past several sessions.
On the chart , the fib levels are drawn from the recent past swing high
to the swing low. An anchored VWAP is set at the swing high.
Price is currently just above the VWAP and the 0.5 Fib level.
These are both likely support for a reversal. I will look for volatility
and enter a long trade upon confirmation. MACD and RSI are both
showing bullish divergence ( Stop loss at the fib level
below the entry. Frist target is the upper band of the VWAP
and final target is the red line horizontal resistance)
Trade closed: stop reached
NAS100 fell through the fib levels and had a bad day like much of the equities market
Disclaimer
The information and publications are not meant to be, and do not constitute, financial, investment, trading, or other types of advice or recommendations supplied or endorsed by TradingView. Read more in the Terms of Use.
Disclaimer
The information and publications are not meant to be, and do not constitute, financial, investment, trading, or other types of advice or recommendations supplied or endorsed by TradingView. Read more in the Terms of Use.