1. Key Observations (Volume, Gann & CVD + ADX Focused)
a) Volume Profile Insights:
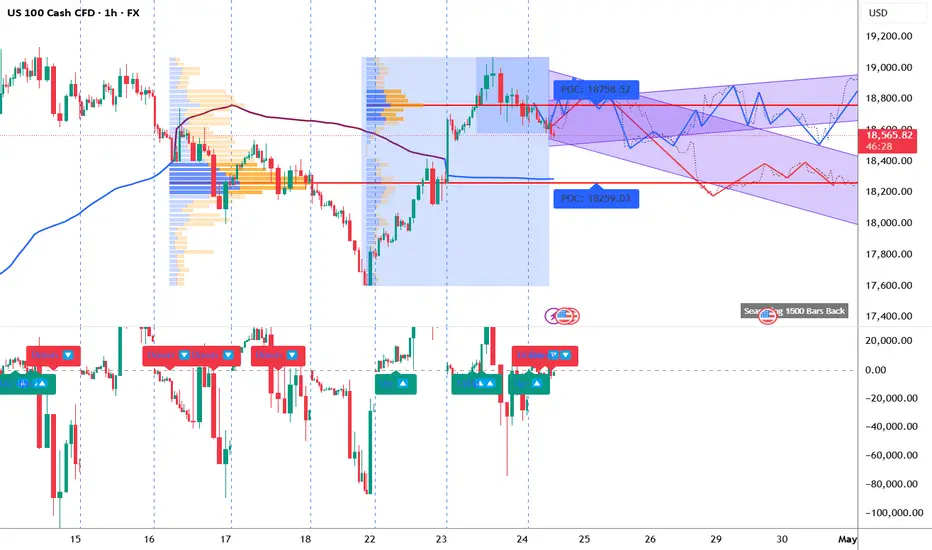
Value Area High (VAH): 18,758.52
Value Area Low (VAL): Approx. 18,259.03
Point of Control (POC):
Recent Session POC: 18,758.52
Previous Session POC: 18,259.03
High-volume nodes: Clustered around 18,600–18,750 – area of high interest and possible re-accumulation.
Low-volume gaps: Below 18,300 – could act as fast-move zones on breakdown.
b) Liquidity Zones:
Stop Clusters:
Above 18,800 (recent swing high).
Below 18,250 (previous swing low).
Absorption Zones (Delta Volume Focus):
Strong absorption around 18,580–18,600; price has consolidated here indicating order filling.
c) Volume-Based Swing Highs/Lows:
High-volume swing low: 18,259.03 (POC) – strong buying response seen post drop.
High-volume swing high: 18,758.52 – rejection seen here on low follow-through.
d) CVD + ADX Indicator Analysis:
Trend Direction: Currently Range-bound (CVD not showing clear accumulation/distribution trend).
ADX Strength:
ADX ≈ 18–20: Suggests weakening trend; possible sideways movement.
DI+ ≈ DI-: Confirms indecision.
CVD Confirmation:
CVD flattening at resistance suggests equal pressure from buyers and sellers.
No strong rising or falling trend in CVD; supports ranging bias.
2. Support & Resistance Levels
a) Volume-Based Levels:
Support:
VAL: 18,259.03
Previous swing low/absorption: 18,300
Resistance:
VAH: 18,758.52
Rejection level: 18,800
b) Gann-Based Levels:
Confirmed Gann Lows: 18,259
Key Retracement Levels:
1/3 retrace from recent high: ~18,430
1/2 retrace: ~18,500
2/3 retrace: ~18,580
3. Chart Patterns & Market Structure
a) Trend:
Range-bound (confirmed by ADX near 20 and mixed CVD).
b) Notable Patterns:
Bearish rejection at VAH zone.
Potential descending channel forming from highs.
Fake-out above 18,750 followed by rejection – possible liquidity grab.
4. Trade Setup & Risk Management
a) Bullish Entry (If CVD + ADX confirm uptrend):
Entry Zone: Near 18,300–18,350 (absorption + VAL zone)
Targets:
T1: 18,580
T2: 18,750
Stop-Loss: Below 18,250
RR: Minimum 1:2
b) Bearish Entry (If CVD + ADX confirm downtrend):
Entry Zone: Near 18,750–18,800 (rejection area)
Target:
T1: 18,300
Stop-Loss: Above 18,850
RR: Minimum 1:2
c) Position Sizing:
Risk 1–2% of total capital per trade for optimal drawdown management.
a) Volume Profile Insights:
Value Area High (VAH): 18,758.52
Value Area Low (VAL): Approx. 18,259.03
Point of Control (POC):
Recent Session POC: 18,758.52
Previous Session POC: 18,259.03
High-volume nodes: Clustered around 18,600–18,750 – area of high interest and possible re-accumulation.
Low-volume gaps: Below 18,300 – could act as fast-move zones on breakdown.
b) Liquidity Zones:
Stop Clusters:
Above 18,800 (recent swing high).
Below 18,250 (previous swing low).
Absorption Zones (Delta Volume Focus):
Strong absorption around 18,580–18,600; price has consolidated here indicating order filling.
c) Volume-Based Swing Highs/Lows:
High-volume swing low: 18,259.03 (POC) – strong buying response seen post drop.
High-volume swing high: 18,758.52 – rejection seen here on low follow-through.
d) CVD + ADX Indicator Analysis:
Trend Direction: Currently Range-bound (CVD not showing clear accumulation/distribution trend).
ADX Strength:
ADX ≈ 18–20: Suggests weakening trend; possible sideways movement.
DI+ ≈ DI-: Confirms indecision.
CVD Confirmation:
CVD flattening at resistance suggests equal pressure from buyers and sellers.
No strong rising or falling trend in CVD; supports ranging bias.
2. Support & Resistance Levels
a) Volume-Based Levels:
Support:
VAL: 18,259.03
Previous swing low/absorption: 18,300
Resistance:
VAH: 18,758.52
Rejection level: 18,800
b) Gann-Based Levels:
Confirmed Gann Lows: 18,259
Key Retracement Levels:
1/3 retrace from recent high: ~18,430
1/2 retrace: ~18,500
2/3 retrace: ~18,580
3. Chart Patterns & Market Structure
a) Trend:
Range-bound (confirmed by ADX near 20 and mixed CVD).
b) Notable Patterns:
Bearish rejection at VAH zone.
Potential descending channel forming from highs.
Fake-out above 18,750 followed by rejection – possible liquidity grab.
4. Trade Setup & Risk Management
a) Bullish Entry (If CVD + ADX confirm uptrend):
Entry Zone: Near 18,300–18,350 (absorption + VAL zone)
Targets:
T1: 18,580
T2: 18,750
Stop-Loss: Below 18,250
RR: Minimum 1:2
b) Bearish Entry (If CVD + ADX confirm downtrend):
Entry Zone: Near 18,750–18,800 (rejection area)
Target:
T1: 18,300
Stop-Loss: Above 18,850
RR: Minimum 1:2
c) Position Sizing:
Risk 1–2% of total capital per trade for optimal drawdown management.
Bharat Pandya @ProspireWealth
+91 9624044866
pandyabn76@gmail.com
+91 9624044866
pandyabn76@gmail.com
Disclaimer
The information and publications are not meant to be, and do not constitute, financial, investment, trading, or other types of advice or recommendations supplied or endorsed by TradingView. Read more in the Terms of Use.