Technology stocks in the US 100 have been leading the resurgence of US assets back up from their April lows for a while now, driven higher by fresh demand for magnificent 7 stocks, artificial intelligence capital expenditure and increased expectations for Federal Reserve (Fed) interest rate cuts, which its hoped by traders will restart again when the Fed have their next rate decision meeting on September 17th.
Dips in the US 100 have remained shallow, with the latest blip lower, caused by a weaker than expected US Non-farm payrolls report, causing a sell off from the record high set on July 31st at 23730 down to a low at 22678 (Payrolls Friday August 1st) before the uptrend resumed again, setting a new record closing high at 23660 on Friday since when prices have consolidated so far this week between 23500 and 23716.
Today could potentially be moving day for US 100 stocks with the latest US CPI release due at 1330 BST. Traders are very sensitive to US inflation updates right now as they await the effects of President Trump’s trade tariffs to feed through into higher consumer prices. US corporates initially absorbed the higher tariff costs which has helped to shield US consumers but there has been signs that this trend may be starting to change.
Any deviation in today’s US CPI release from market expectations may alter the current pricing for Fed rate cuts across the next 6 months, which could have an outsized impact on US 100 volatility across the remainder of this week.
Technical Update: Is the Trend Still Your Friend?
When an asset gains fresh buying support and approaches a previous all-time price high, it can be a very important period for both price action and traders. It can lead to the question being asked.
Will buying pressure be strong enough to break above this important resistance and extend the bullish trend, or will sellers re-emerge at the all-time high, triggering a potential reversal in price?

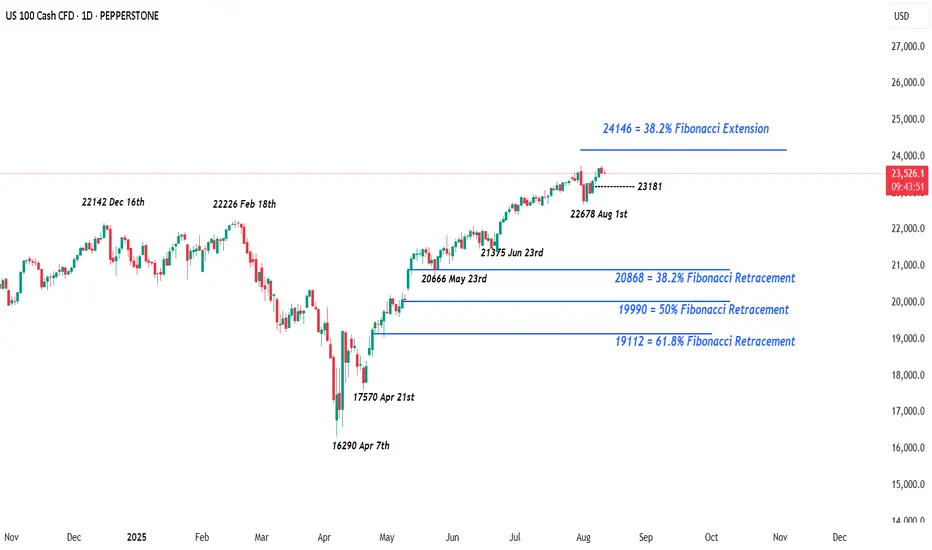
This appears to be the backdrop unfolding for the US 100 index, and as the chart above shows, having seen price weakness briefly post the August 1st low at 22678, the latest price strength since that dip is currently testing 23730 again, the all-time high registered on July 31st.
This 23730 resistance level could be an important focus for traders this week, as successful closing breaks above the all-time high are required to suggest potential for a more sustained phase of price strength, while failure to close above this 23730 resistance level, may lead to increased possibilities for deeper declines in price.
Potential Upside If a Closing Break Develops Above 23730:
If, and it could still be argued it is a big ‘if’, a successful closing break develops above 23730, it could open potential for further price strength towards the next resistance at 24146, which is equal to the 38.2% Fibonacci extension of the July 31st to August 1st price weakness, may be even further.
Potential downside If the Resistance at 23730 Holds:
It is equally possible, the resistance at 23730 can cap the current strength, even prompt fresh selling pressure to turn price activity lower for a phase of weakness.
While 23730 continues to limit current price strength, the focus may shift to possible support at 23181, which is equal to half the August price strength. Closing breaks below 23181 could potentially be a catalyst for further declines to test 22678, the August 1st low, and even lower if this level in turn gives way.
The material provided here has not been prepared accordance with legal requirements designed to promote the independence of investment research and as such is considered to be a marketing communication. Whilst it is not subject to any prohibition on dealing ahead of the dissemination of investment research, we will not seek to take any advantage before providing it to our clients.
Pepperstone doesn’t represent that the material provided here is accurate, current or complete, and therefore shouldn’t be relied upon as such. The information, whether from a third party or not, isn’t to be considered as a recommendation; or an offer to buy or sell; or the solicitation of an offer to buy or sell any security, financial product or instrument; or to participate in any particular trading strategy. It does not take into account readers’ financial situation or investment objectives. We advise any readers of this content to seek their own advice. Without the approval of Pepperstone, reproduction or redistribution of this information isn’t permitted.
Dips in the US 100 have remained shallow, with the latest blip lower, caused by a weaker than expected US Non-farm payrolls report, causing a sell off from the record high set on July 31st at 23730 down to a low at 22678 (Payrolls Friday August 1st) before the uptrend resumed again, setting a new record closing high at 23660 on Friday since when prices have consolidated so far this week between 23500 and 23716.
Today could potentially be moving day for US 100 stocks with the latest US CPI release due at 1330 BST. Traders are very sensitive to US inflation updates right now as they await the effects of President Trump’s trade tariffs to feed through into higher consumer prices. US corporates initially absorbed the higher tariff costs which has helped to shield US consumers but there has been signs that this trend may be starting to change.
Any deviation in today’s US CPI release from market expectations may alter the current pricing for Fed rate cuts across the next 6 months, which could have an outsized impact on US 100 volatility across the remainder of this week.
Technical Update: Is the Trend Still Your Friend?
When an asset gains fresh buying support and approaches a previous all-time price high, it can be a very important period for both price action and traders. It can lead to the question being asked.
Will buying pressure be strong enough to break above this important resistance and extend the bullish trend, or will sellers re-emerge at the all-time high, triggering a potential reversal in price?
This appears to be the backdrop unfolding for the US 100 index, and as the chart above shows, having seen price weakness briefly post the August 1st low at 22678, the latest price strength since that dip is currently testing 23730 again, the all-time high registered on July 31st.
This 23730 resistance level could be an important focus for traders this week, as successful closing breaks above the all-time high are required to suggest potential for a more sustained phase of price strength, while failure to close above this 23730 resistance level, may lead to increased possibilities for deeper declines in price.
Potential Upside If a Closing Break Develops Above 23730:
If, and it could still be argued it is a big ‘if’, a successful closing break develops above 23730, it could open potential for further price strength towards the next resistance at 24146, which is equal to the 38.2% Fibonacci extension of the July 31st to August 1st price weakness, may be even further.
Potential downside If the Resistance at 23730 Holds:
It is equally possible, the resistance at 23730 can cap the current strength, even prompt fresh selling pressure to turn price activity lower for a phase of weakness.
While 23730 continues to limit current price strength, the focus may shift to possible support at 23181, which is equal to half the August price strength. Closing breaks below 23181 could potentially be a catalyst for further declines to test 22678, the August 1st low, and even lower if this level in turn gives way.
The material provided here has not been prepared accordance with legal requirements designed to promote the independence of investment research and as such is considered to be a marketing communication. Whilst it is not subject to any prohibition on dealing ahead of the dissemination of investment research, we will not seek to take any advantage before providing it to our clients.
Pepperstone doesn’t represent that the material provided here is accurate, current or complete, and therefore shouldn’t be relied upon as such. The information, whether from a third party or not, isn’t to be considered as a recommendation; or an offer to buy or sell; or the solicitation of an offer to buy or sell any security, financial product or instrument; or to participate in any particular trading strategy. It does not take into account readers’ financial situation or investment objectives. We advise any readers of this content to seek their own advice. Without the approval of Pepperstone, reproduction or redistribution of this information isn’t permitted.
Global risk Warning CFDs are complex instruments and come with a high risk of losing money rapidly due to leverage. Between 74-89% of retail investor accounts lose money when trading in CFDs. You should consider whether you understand how CFD
Disclaimer
The information and publications are not meant to be, and do not constitute, financial, investment, trading, or other types of advice or recommendations supplied or endorsed by TradingView. Read more in the Terms of Use.