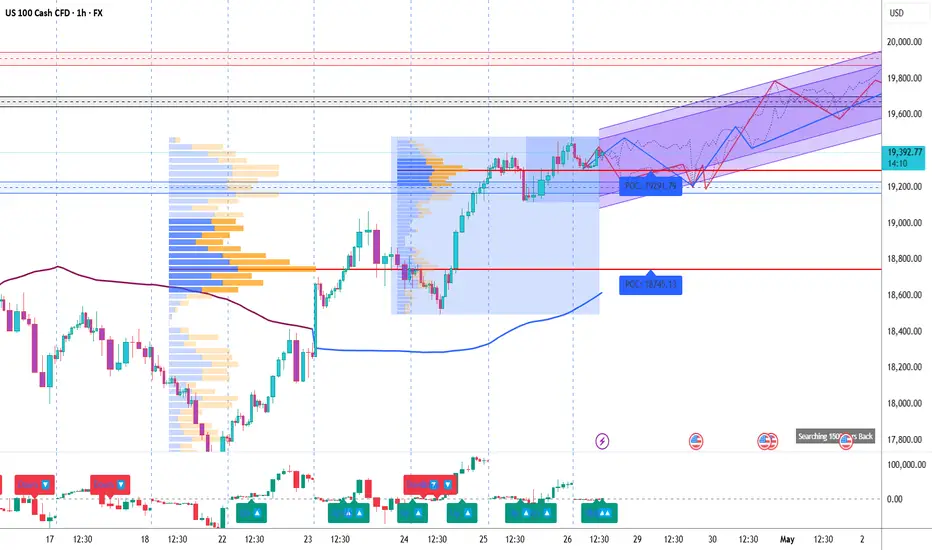
Here’s the detailed breakdown of the US100 1H Chart based on Volume Profile, Gann analysis, and custom indicators (CVD + ADX):
1. Key Observations (Volume, Gann & CVD + ADX Focused)
a) Volume Profile Insights:
Value Area High (VAH): 19,383
Value Area Low (VAL): 19,220
Point of Control (POC): 19,291.79
High-volume nodes: Clustered around 19,220 to 19,300 (heavy acceptance).
Low-volume gaps: Above 19,400 and below 19,200 — price can accelerate through these zones.
b) Liquidity Zones:
Stop clusters likely at: Above 19,400 (recent swing highs). Below 19,200 (recent breakout area).
Order absorption zones: Around 19,291 (POC) and 19,220 (high bid absorption).
c) Volume-Based Swing Highs/Lows:
Swing High: 19,382 (testing resistance with moderate volume).
Swing Low: 19,220 (breakout launch pad).
d) CVD + ADX Indicator Analysis:
Trend Direction: Uptrend
ADX Strength: ADX > 20 and DI+ > DI-, confirming strong bullish momentum.
CVD Confirmation: Rising CVD + bullish candles = Strong demand and genuine buying pressure.
2. Support & Resistance Levels
a) Volume-Based Levels:
Support: 19,291.79 (POC) 19,220 (VAL & previous demand zone)
Resistance: 19,382-19,400 (current tested highs and potential breakout point)
b) Gann-Based Levels:
Recent Gann Swing High: 19,382
Recent Gann Swing Low: 19,220
Key retracements: 1/2 level: 19,301 1/3 level: 19,274 2/3 level: 19,328
3. Chart Patterns & Market Structure
a) Trend:
Strong Bullish (confirmed by rising ADX and CVD).
b) Notable Patterns:
Ascending Channel: Clear uptrend with higher highs and higher lows inside the purple channel.
Breakout retest: POC retest around 19,291 before moving higher.
No major topping signals yet — still holding structure.
4. Trade Setup & Risk Management
a) Bullish Entry (If CVD + ADX confirm uptrend):
Entry Zone: 19,290–19,310 (near POC support zone)
Targets: T1: 19,400 (swing high breakout) T2: 19,500 (measured move from channel)
Stop-Loss (SL): 19,220 (below VAL and previous swing low)
RR: Minimum 1:2
b) Bearish Entry (If CVD + ADX confirm downtrend):
Entry Zone: 19,380–19,400 (at resistance failure)
Target: T1: 19,290 (POC retest)
Stop-Loss (SL): 19,450 (above resistance breakout trap)
RR: Minimum 1:2
c) Position Sizing:
Risk only 1-2% of trading capital per trade.
Bharat Pandya @ProspireWealth
+91 9624044866
pandyabn76@gmail.com
+91 9624044866
pandyabn76@gmail.com
Disclaimer
The information and publications are not meant to be, and do not constitute, financial, investment, trading, or other types of advice or recommendations supplied or endorsed by TradingView. Read more in the Terms of Use.