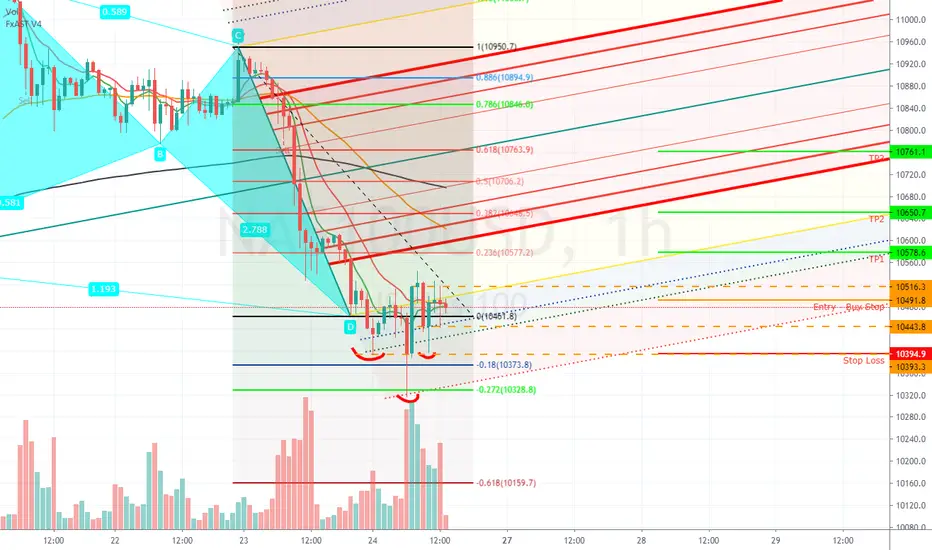
I like this because we have a lot of messages telling us that price wants to go long. What we have here is an inverted buddha temple/inverted head and shoulders pattern.
From the left side of the pattern, we can see that we had a healthy wick off of support, then an engulfing bullish candle. There wasn't enough bullish STRENGTH to engulf the left side bearish candles that started the downward movement (yet), so we see that doji at the top and then a bearish engulfing doji, doji, bearish hammer (dumpling top/"ugly" evening star pattern). This next move with the bullish engulfing candle ENGULFED all of the previous movements and formed a bullish belt top pattern. The next evening star pattern move by the bears didn't have enough strength to take out the last step by the bulls, and we see right after that a nice hammer (all at support 10393.3) forming the right side of the pattern.
We see that as the price continued before the close on Friday that we round resistance at the top of the bullish belt top. My trading range is between 10516.3 - 150393.3, with 10443.8 being the halfway point. I am not "expecting" price action to come back down past that area, but if it does, I have a pending buy limit at the bottom.
Disclaimer
The information and publications are not meant to be, and do not constitute, financial, investment, trading, or other types of advice or recommendations supplied or endorsed by TradingView. Read more in the Terms of Use.
Disclaimer
The information and publications are not meant to be, and do not constitute, financial, investment, trading, or other types of advice or recommendations supplied or endorsed by TradingView. Read more in the Terms of Use.