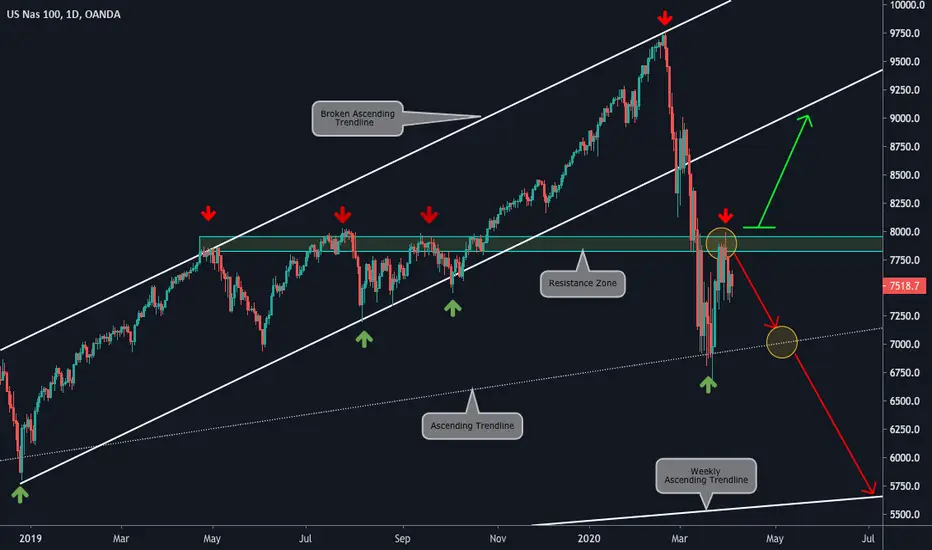
Daily Chart Explanation:
- Price broke the Ascending Channel and, then, went towards the Ascending Trendline.
- It bounced from there until it faced the Resistance Zone.
- After that, it started the down move again.
- We will be looking for sell setups until price breaks the Resistance Zone at 8.000.
4H Vision:

Weekly Vision:

Updates coming soon!
- Price broke the Ascending Channel and, then, went towards the Ascending Trendline.
- It bounced from there until it faced the Resistance Zone.
- After that, it started the down move again.
- We will be looking for sell setups until price breaks the Resistance Zone at 8.000.
4H Vision:
Weekly Vision:
Updates coming soon!
Disclaimer
The information and publications are not meant to be, and do not constitute, financial, investment, trading, or other types of advice or recommendations supplied or endorsed by TradingView. Read more in the Terms of Use.
Disclaimer
The information and publications are not meant to be, and do not constitute, financial, investment, trading, or other types of advice or recommendations supplied or endorsed by TradingView. Read more in the Terms of Use.