Hello?
Traders, welcome.
If you "Follow", you can always get new information quickly.
Please also click "Boost".
Have a good day.
-------------------------------------

--------------------------------------
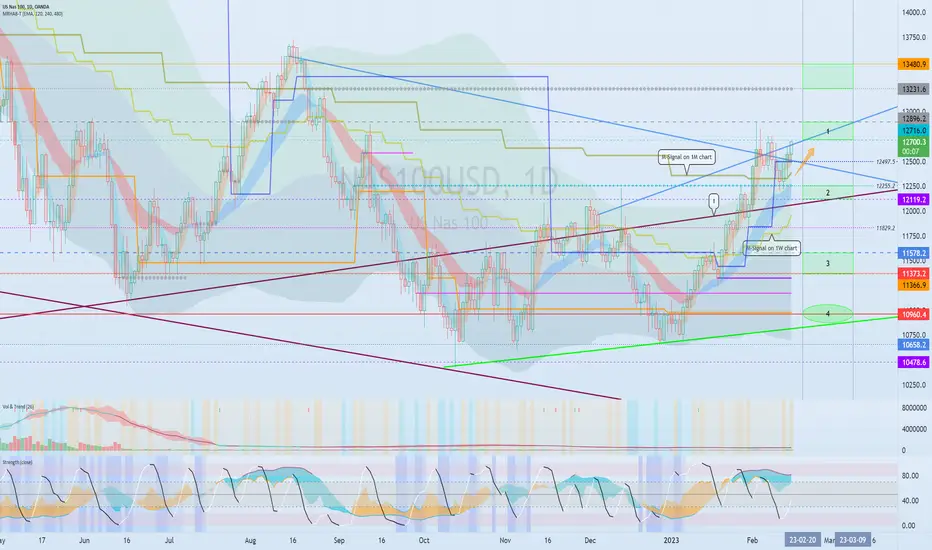
(NAS100USD 1D chart)
After the next volatility period around February 20th, we need to see if it can hold above 12716.0.
If not, you should check for support around 12497.5.
-----------------------------------------
(DXY chart)

It is necessary to check which direction it deviates from the 103.494-104.738 section.
If it rises above 104.738-105.873, the investment market is likely to enter a recession.
I think it needs to fall below 102.020 for the investment market to be active.
-------------------------------------------

-------------------------------------------------- -------------------------------------------
** All descriptions are for reference only and do not guarantee profit or loss in investment.
** If you share this chart, you can use the indicators normally.
** The MRHAB-T indicator includes indicators that indicate points of support and resistance.
** Check the formulas for the MS-Signal, HA-Low, and HA-High indicators at (tradingview.com/script/OUA6XoS6-HeikinAshi-MS-Signal-HA-MS/).
(Short-term Stop Loss can be said to be a point where profit or loss can be preserved or additional entry can be made by split trading. This is a short-term investment perspective.)
---------------------------------
Traders, welcome.
If you "Follow", you can always get new information quickly.
Please also click "Boost".
Have a good day.
-------------------------------------
--------------------------------------
(NAS100USD 1D chart)
After the next volatility period around February 20th, we need to see if it can hold above 12716.0.
If not, you should check for support around 12497.5.
-----------------------------------------
(DXY chart)
It is necessary to check which direction it deviates from the 103.494-104.738 section.
If it rises above 104.738-105.873, the investment market is likely to enter a recession.
I think it needs to fall below 102.020 for the investment market to be active.
-------------------------------------------
-------------------------------------------------- -------------------------------------------
** All descriptions are for reference only and do not guarantee profit or loss in investment.
** If you share this chart, you can use the indicators normally.
** The MRHAB-T indicator includes indicators that indicate points of support and resistance.
** Check the formulas for the MS-Signal, HA-Low, and HA-High indicators at (tradingview.com/script/OUA6XoS6-HeikinAshi-MS-Signal-HA-MS/).
(Short-term Stop Loss can be said to be a point where profit or loss can be preserved or additional entry can be made by split trading. This is a short-term investment perspective.)
---------------------------------
Note
The question is whether it can rise above 12497.5 after around February 20th.
If not, you need to make sure it is supported in section 2.
Other content (coins, stocks, etc.) is frequently posted on X.
X에 다른 내용(코인, 주식 등)이 자주 게시.
◆ t.me/readCryptoChannel
[HA-MS Indicator]
bit.ly/3YxHgvN
[OBV Indicator]
bit.ly/4dcyny3
X에 다른 내용(코인, 주식 등)이 자주 게시.
◆ t.me/readCryptoChannel
[HA-MS Indicator]
bit.ly/3YxHgvN
[OBV Indicator]
bit.ly/4dcyny3
Related publications
Disclaimer
The information and publications are not meant to be, and do not constitute, financial, investment, trading, or other types of advice or recommendations supplied or endorsed by TradingView. Read more in the Terms of Use.