Trend Analysis
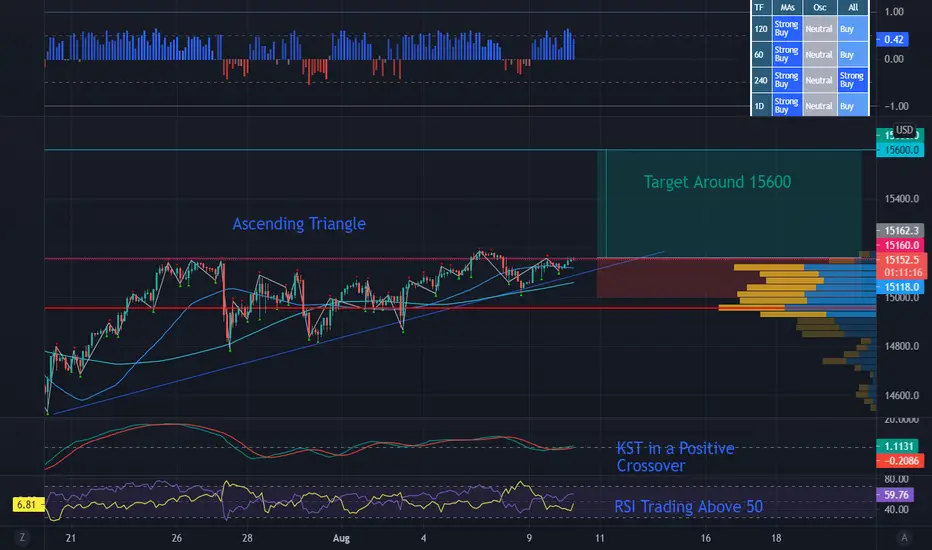
The main view of this trade idea is on the 2-Hour Chart. The heavily weighted NAS100 Index is in an ascending triangle setup, with the horizontal resistance line around the 15160 price level. The upward sloping support trend line is mainly connecting the lows at around 14870 and 15000. If NAS100 breaks out, it is targeted to reach towards 15600. The stop loss is below the support trend line at around 15000. Hitting this stop loss is a signal of a failure of the setup.
Technical Indicators
The technical indicators support the bullish view of the chart pattern setup. NAS100 is currently above its short (25 period) and medium (75 period) fractal moving averages. The KST is in a positive crossover and the RSI is trading above 50 with its momentum not at an extreme level, indicating there can be more upward movement in the trend. Also there are overall buy signals over multiple timeframes (1-hour, 4-hour and Daily) in respective moving averages and oscillators.
Recommendation
The recommendation will be to go long at market. Stop loss will be set around the 15000 price level and a target of 15600. This produces a risk-reward ratio of 2.70.
Disclaimer
The views expressed are mine and do not represent the views of my employers and business partners. Persons acting on these recommendations are doing so at their own risk. These recommendations are not a solicitation to buy or to sell but are for purely discussion purposes. At the time publishing, I have a position in NAS100.
Trade closed: stop reached
Disclaimer
The information and publications are not meant to be, and do not constitute, financial, investment, trading, or other types of advice or recommendations supplied or endorsed by TradingView. Read more in the Terms of Use.
Disclaimer
The information and publications are not meant to be, and do not constitute, financial, investment, trading, or other types of advice or recommendations supplied or endorsed by TradingView. Read more in the Terms of Use.