Hello?
Traders, welcome.
If you "Follow", you can always get new information quickly.
Please also click "Boost".
Have a good day.
-------------------------------------
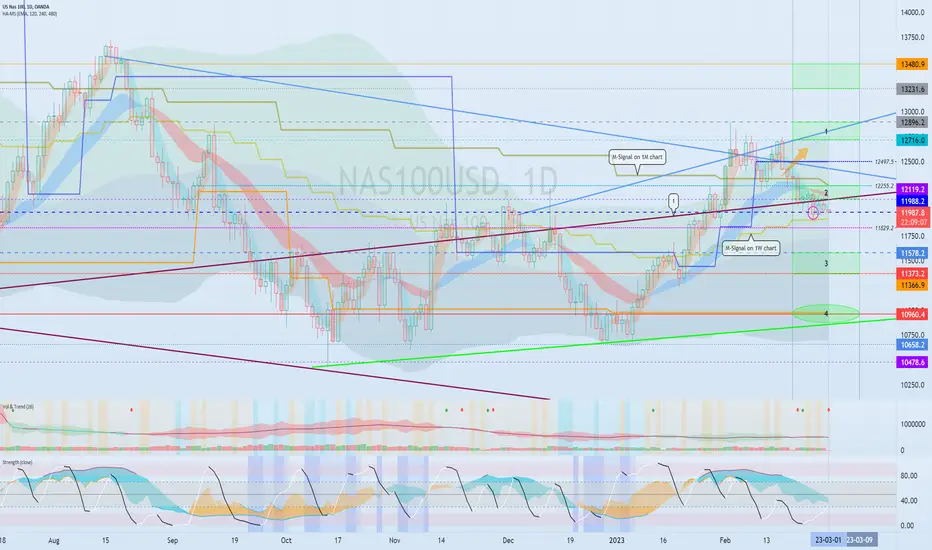
(NAS100USD chart)

We need to see if we can find support at 11988.2 and rise above 12119.2 in the volatility period until March 2nd.
If it fails to find support near 11988.2, I would expect it to fall towards section 3, 11366.9-11578.2.
------------------------------------------
(DXY chart)

If it rises above the 104.738-105.873 range, the investment market is likely to enter a recession.
Therefore, it should drop to or below the 102.020-103.494 range.
----------------------------------------------
(SPX500USD chart)

The key is whether it can get support around 3931.2 and move up along the uptrend line.
If not, I expect it to fall around 3854.4.
-------------------------------------------------- -------------------------------------------
** All descriptions are for reference only and do not guarantee profit or loss in investment.
---------------------------------
Traders, welcome.
If you "Follow", you can always get new information quickly.
Please also click "Boost".
Have a good day.
-------------------------------------
(NAS100USD chart)
We need to see if we can find support at 11988.2 and rise above 12119.2 in the volatility period until March 2nd.
If it fails to find support near 11988.2, I would expect it to fall towards section 3, 11366.9-11578.2.
------------------------------------------
(DXY chart)
If it rises above the 104.738-105.873 range, the investment market is likely to enter a recession.
Therefore, it should drop to or below the 102.020-103.494 range.
----------------------------------------------
(SPX500USD chart)
The key is whether it can get support around 3931.2 and move up along the uptrend line.
If not, I expect it to fall around 3854.4.
-------------------------------------------------- -------------------------------------------
** All descriptions are for reference only and do not guarantee profit or loss in investment.
---------------------------------
Note
(NAS100USD chart)The key is whether it can rise above 11988.2.
If not, you should check if there is support around 11829.2.
(SPX500USD chart)
The key is whether it can get support around 3931.2 and move up along the uptrend line.
(DXY chart)
If it rises above the 104.738-105.873 range, the investment market is likely to enter a calming period.
So, we need to see if a drop below 101.494 can energize the investment market.
Note
(SPX500USD chart)The HA-High indicator on the 1D chart is about to be created at 3984.7.
So, you need to make sure it spawns on branch 3984.7.
If it fails to rise above 3984.7, it is expected to make new lows.
Note
(NAS100USD chart)I would like to ask those who say that the volatility of the coin market is a problem.
How is the stock market different?
The next period of volatility is around March 9th.
Other content (coins, stocks, etc.) is frequently posted on X.
X에 다른 내용(코인, 주식 등)이 자주 게시.
◆ t.me/readCryptoChannel
[HA-MS Indicator]
bit.ly/3YxHgvN
[OBV Indicator]
bit.ly/4dcyny3
X에 다른 내용(코인, 주식 등)이 자주 게시.
◆ t.me/readCryptoChannel
[HA-MS Indicator]
bit.ly/3YxHgvN
[OBV Indicator]
bit.ly/4dcyny3
Related publications
Disclaimer
The information and publications are not meant to be, and do not constitute, financial, investment, trading, or other types of advice or recommendations supplied or endorsed by TradingView. Read more in the Terms of Use.