Chart Overview Date: July 7, 2025
Market: NAS100 (US Tech 100 Index)
Timeframe: 15-Minute
Chart Context: Clean with Price Action Focus
🧠 Market Structure
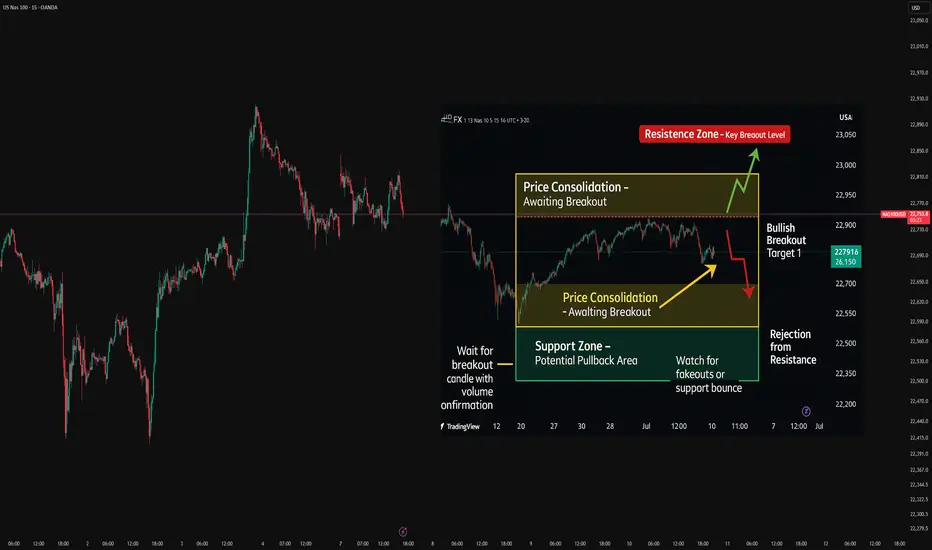
Overall uptrend structure since June 21st – higher highs and higher lows.
Key resistance zone: 22,900 – price was rejected here multiple times.
Support area: 22,500 – formed after bullish impulsive move and retest.
🎯 Entry Scenario
Currently in a sideways consolidation between 22,700 – 22,900.
A break above 22,900 with strong volume can lead to a bullish continuation.
Alternatively, a rejection near 22,900 with bearish engulfing candle may offer a short scalp back toward 22,700.
📈 Bias & Confirmation
Trend Bias: Bullish
Wait for:
Breakout and close above resistance for long.
Rejection and bearish signal at resistance for short.
📌 Plan
Type Trigger SL TP Target 1 TP Target 2
Long Break & close >22,900 <22,800 23,050 23,150
Short Rejection 22,900 >22,950 22,720 22,600
"📊 Clean and structured technical analysis on NAS100 – Currently consolidating after a strong uptrend. Watching key levels around 22,900 for breakout or rejection scenario.
Trade safe. 📈 #ALIPFX #TechnicalAnalysis #NAS100"
Market: NAS100 (US Tech 100 Index)
Timeframe: 15-Minute
Chart Context: Clean with Price Action Focus
🧠 Market Structure
Overall uptrend structure since June 21st – higher highs and higher lows.
Key resistance zone: 22,900 – price was rejected here multiple times.
Support area: 22,500 – formed after bullish impulsive move and retest.
🎯 Entry Scenario
Currently in a sideways consolidation between 22,700 – 22,900.
A break above 22,900 with strong volume can lead to a bullish continuation.
Alternatively, a rejection near 22,900 with bearish engulfing candle may offer a short scalp back toward 22,700.
📈 Bias & Confirmation
Trend Bias: Bullish
Wait for:
Breakout and close above resistance for long.
Rejection and bearish signal at resistance for short.
📌 Plan
Type Trigger SL TP Target 1 TP Target 2
Long Break & close >22,900 <22,800 23,050 23,150
Short Rejection 22,900 >22,950 22,720 22,600
"📊 Clean and structured technical analysis on NAS100 – Currently consolidating after a strong uptrend. Watching key levels around 22,900 for breakout or rejection scenario.
Trade safe. 📈 #ALIPFX #TechnicalAnalysis #NAS100"
Disclaimer
The information and publications are not meant to be, and do not constitute, financial, investment, trading, or other types of advice or recommendations supplied or endorsed by TradingView. Read more in the Terms of Use.
Disclaimer
The information and publications are not meant to be, and do not constitute, financial, investment, trading, or other types of advice or recommendations supplied or endorsed by TradingView. Read more in the Terms of Use.