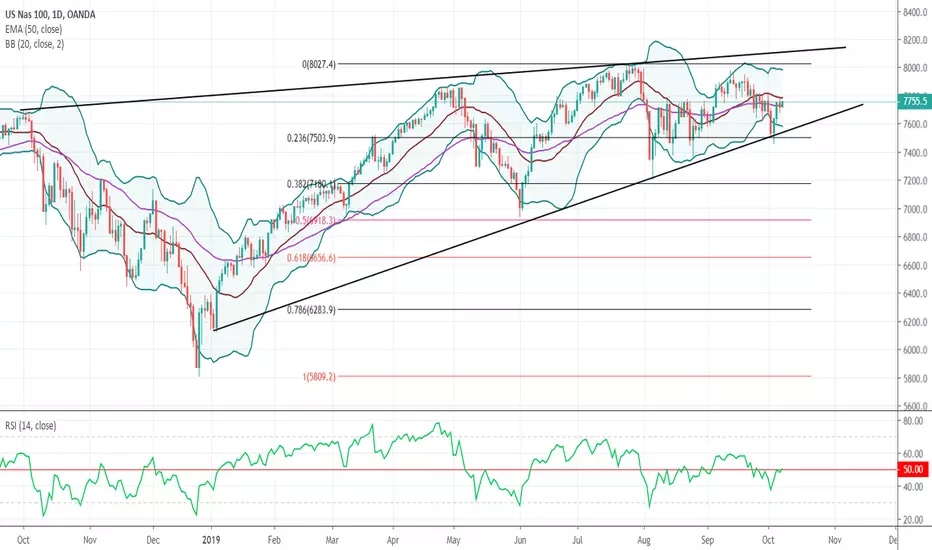
In 1 chart middle bollinger band work as a support line and price is moving to upper bollinger band. In 4 chart 50 EMA is working as a support. 50 EMA is below the 150 EMA which giving us a bullish confirmation.
Daily chart shows its bullish trend as well and RSI line is crossing the 50 level.
TP's & SL is up to you.
Note: Trade at your own risk and no any fundamentals are involved.
Like us and comment on us.
turningpointfx.com/nas100-buy-now/
Daily chart shows its bullish trend as well and RSI line is crossing the 50 level.
TP's & SL is up to you.
Note: Trade at your own risk and no any fundamentals are involved.
Like us and comment on us.
turningpointfx.com/nas100-buy-now/
Disclaimer
The information and publications are not meant to be, and do not constitute, financial, investment, trading, or other types of advice or recommendations supplied or endorsed by TradingView. Read more in the Terms of Use.
Disclaimer
The information and publications are not meant to be, and do not constitute, financial, investment, trading, or other types of advice or recommendations supplied or endorsed by TradingView. Read more in the Terms of Use.