"📉 NASDAQ at Make-or-Break Resistance – Is a Sharp Drop to 23,292 Next?"
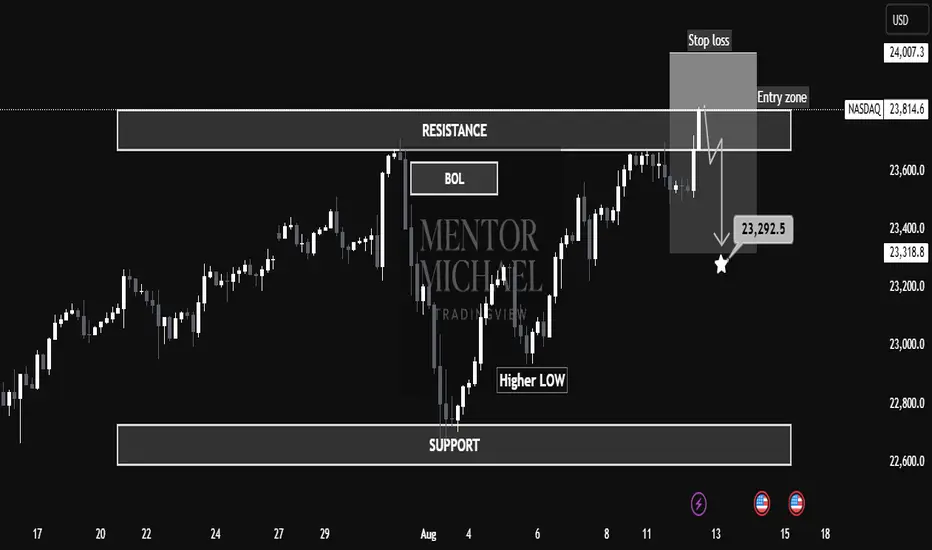
📊 NASDAQ is currently trading within a well-defined resistance zone (23,812 – 24,007) after a recent rally from the support base near 22,800. The structure suggests a potential sell-side setup if price respects the resistance and fails to break higher.
🧐 Market Structure Analysis
Support Zone: Around 22,800, where buyers previously stepped in, forming a Higher Low and initiating the last bullish leg.
Resistance Zone: 23,812 – 24,007, marked by previous rejections and a Break of Liquidity (BOL).
Price has tapped into the entry zone just below resistance, hinting at possible exhaustion from buyers.
The chart indicates a bearish bias from this zone, aiming for a move toward 23,292.5 (marked target).
🎯 Educational Trade Example
Entry Zone: 23,812 – 24,007
Stop Loss: Above 24,007 to protect against breakout rallies.
Target: 23,292.5 (aligned with previous structural support).
Rationale:
Trading against strong resistance offers asymmetric R:R if momentum shifts bearish.
The Higher Low before resistance can act as liquidity fuel for sellers once demand weakens.
Clear invalidation point keeps risk defined.
⚠ Invalidation Scenarios
A strong breakout and close above 24,007 with follow-through volume would invalidate the short idea and potentially signal continuation toward 24,200+.
💡 Key Takeaways for Students
Zone-to-Zone Trading: Always define both entry and exit zones before execution.
Structure Before Strategy: The market’s reaction to resistance is the clue — confirmation comes before position sizing.
Risk Management is Non-Negotiable: Even high-probability setups require strict stop placement.
Trade active
NASDAQ Short Trade Active 📉
The market has triggered our short position as price action shows signs of weakness near the recent resistance zone. Sellers are stepping in with increased volume, confirming bearish momentum. We’ll monitor key support levels for potential profit-taking opportunities, while keeping a close eye on volatility that could drive sharp moves.
Market Analyst | XAU/USD Focused
Educational Content & Technical Breakdowns Premium
VIP Signals Live trades & strategies shared daily
join our Telegram t.me/Mentor_Michael033
Message Me to Join VIP Mentorship t.me/Mentor_Michael03
Educational Content & Technical Breakdowns Premium
VIP Signals Live trades & strategies shared daily
join our Telegram t.me/Mentor_Michael033
Message Me to Join VIP Mentorship t.me/Mentor_Michael03
Disclaimer
The information and publications are not meant to be, and do not constitute, financial, investment, trading, or other types of advice or recommendations supplied or endorsed by TradingView. Read more in the Terms of Use.