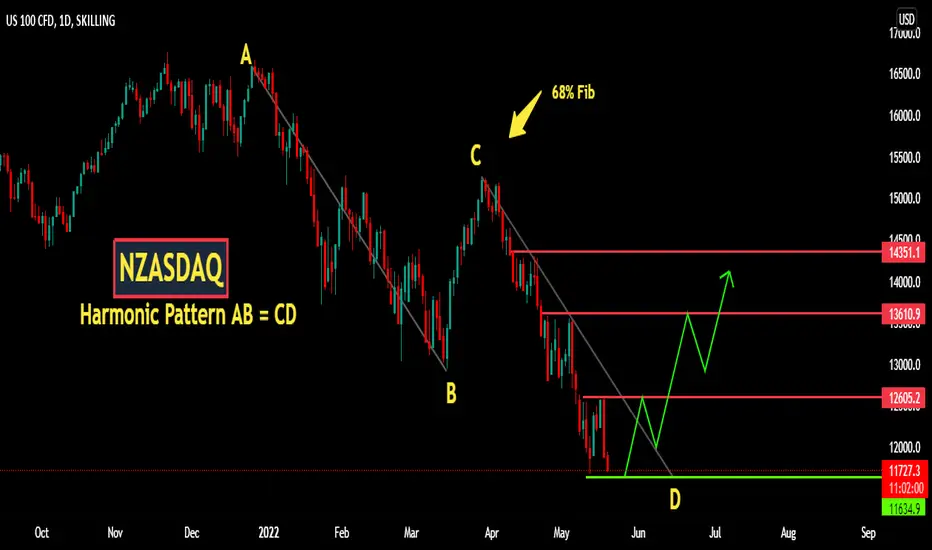
NASDAQ has been defining its bottom near 11600 where harmonics pattern AB=CD is completed.
The bulls should be active from here now as RSI has bullish divergence and intra day charts shows oversold condition.
We are expecting a bounce to atleast 12600 from here which has been strong area for the bears.
The bulls should be active from here now as RSI has bullish divergence and intra day charts shows oversold condition.
We are expecting a bounce to atleast 12600 from here which has been strong area for the bears.
Related publications
Disclaimer
The information and publications are not meant to be, and do not constitute, financial, investment, trading, or other types of advice or recommendations supplied or endorsed by TradingView. Read more in the Terms of Use.
Related publications
Disclaimer
The information and publications are not meant to be, and do not constitute, financial, investment, trading, or other types of advice or recommendations supplied or endorsed by TradingView. Read more in the Terms of Use.