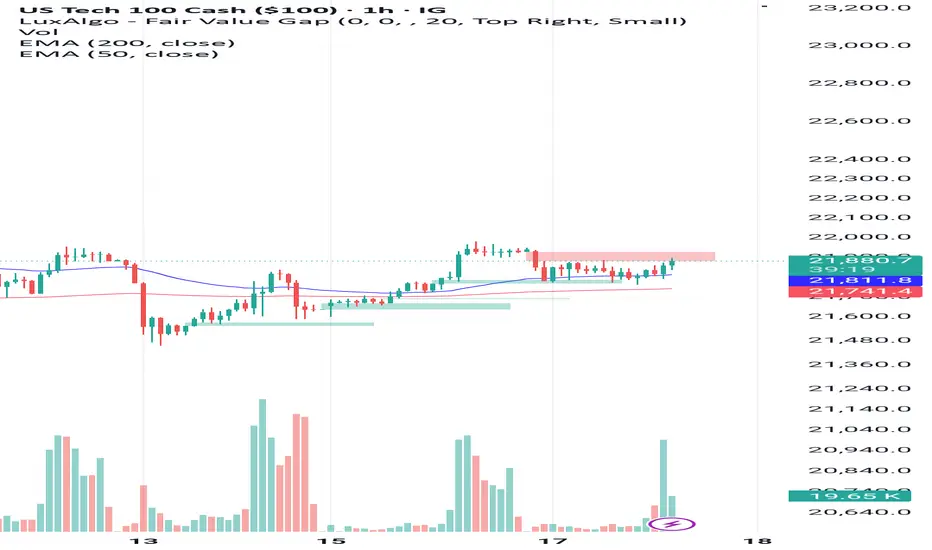
The EMA 50 on the hourly chart at 21,810 has been an area of support. Breaking down blow this level will send the price searching for EMA 200 at 21,740. Above 21,900 there is an FVG from earlier today and breaking through the upper bound at 21,940 will likely send the price upwards beyond yesterday's swing high.
Disclaimer
The information and publications are not meant to be, and do not constitute, financial, investment, trading, or other types of advice or recommendations supplied or endorsed by TradingView. Read more in the Terms of Use.
Disclaimer
The information and publications are not meant to be, and do not constitute, financial, investment, trading, or other types of advice or recommendations supplied or endorsed by TradingView. Read more in the Terms of Use.