🔍 Market Overview:
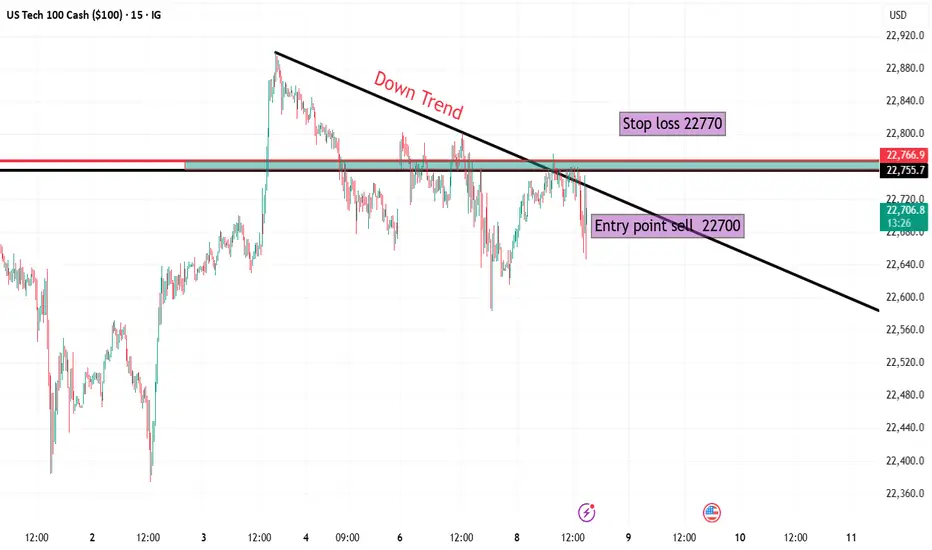
Instrument: US Tech 100 (NASDAQ 100)
Timeframe: 15 Minutes
Current Trend: Short-term downtrend, indicated by the descending trendline connecting recent lower highs.
📉 Trade Setup (Short Position):
Entry Point: 22,700
Price has broken below the trendline and a horizontal resistance zone around 22,750–22,770, confirming bearish pressure.
Stop Loss: 22,770
Placed just above the previous resistance and trendline. A break above this level would invalidate the downtrend structure.
Target: 22,070
This level aligns with a previously tested demand/support zone, offering a logical take-profit area.
📊 Risk/Reward Analysis:
Risk: ~100 points
Reward: ~640 points
Risk-to-Reward Ratio: 1:6, which is excellent and indicates a high potential reward relative to the risk.
📌 Technical Observations:
Trendline: Clearly established downtrend with lower highs.
Breakout Confirmation: Price rejected from trendline + horizontal resistance = confluence zone.
Volume & Momentum (not shown but advisable to check): Traders should confirm the breakout with increased selling volume or bearish momentum indicators (e.g., RSI dropping below 50 or MACD crossing down).
✅ Conclusion:
This is a well-structured short (sell) setup with:
Clear trendline rejection,
Defined entry, stop loss, and target,
A favorable risk-to-reward ratio.
Trade active
Disclaimer
The information and publications are not meant to be, and do not constitute, financial, investment, trading, or other types of advice or recommendations supplied or endorsed by TradingView. Read more in the Terms of Use.
Disclaimer
The information and publications are not meant to be, and do not constitute, financial, investment, trading, or other types of advice or recommendations supplied or endorsed by TradingView. Read more in the Terms of Use.